
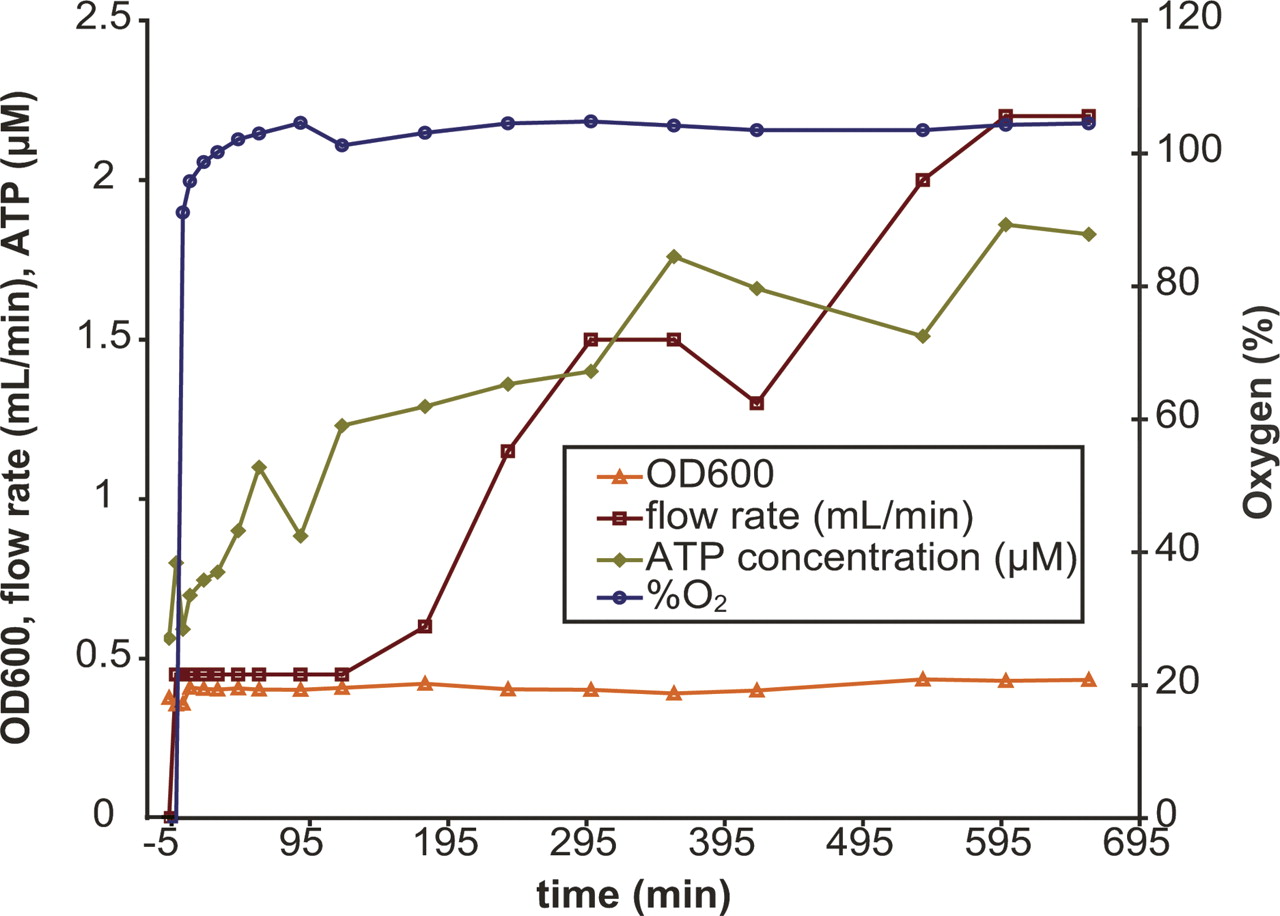
Figure 2.
Physiological characterization of two opposing cell states in H. salinarum NRC-1. ATP and growth measurements during the third chemostat experiment. After a 24-h anoxic incubation period, oxygen was rapidly sparged into the system within 5 min (blue line, right Y-axis), and culture aliquots were removed at the time points indicated for measuring ATP concentration (green line, left Y-axis), transcriptomics (Fig. 3), and cell density (orange line). Flow rate through the chemostat (brown line) is directly proportional to the doubling time of the culture (see Table 1 for conversion of flow rate to doubling time).


