
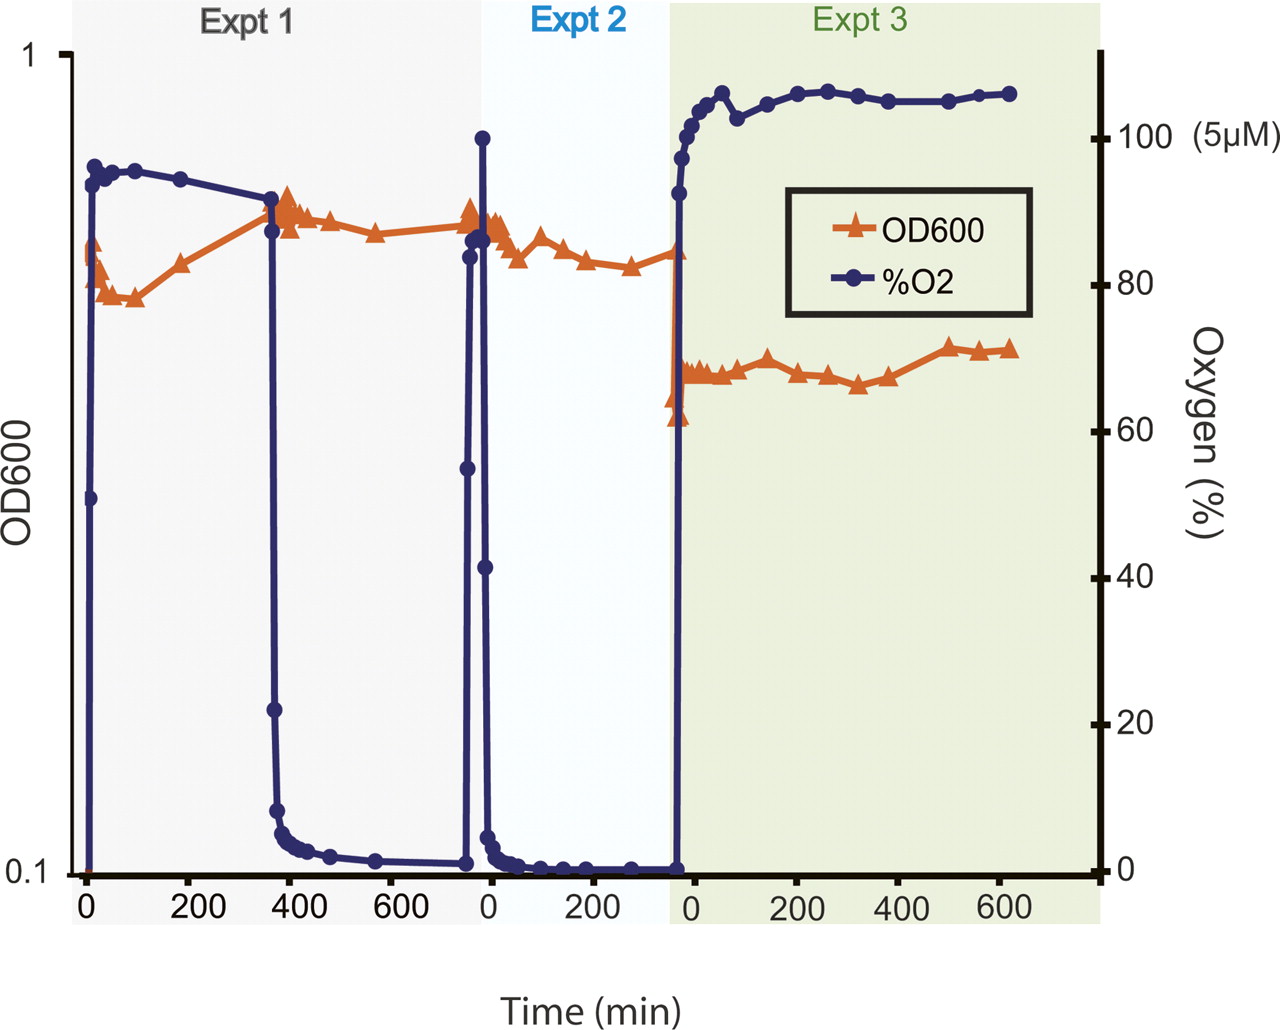
Experimental design. Three separate chemostat experiments were conducted in which H. salinarum NRC-1 cultures were grown in batch mode to mid-logarithmic phase (OD600 ∼ 0.5–0.7), followed by anoxic incubation for 24 h (experiments 1 and 3) or oxic incubation for 12 h (experiment 2). Oxygen tension was then perturbed (blue line) at concentrations shown on the right Y-axis and at time points shown on the X-axis. OD600 measurements (left Y-axis) were taken throughout the experiment (orange line), and culture aliquots were removed for microarray (all three experiments), proteomics (experiment 1), and ATP (experiment 3) analysis at the time points indicated in the graph (blue circles and orange triangles) and as listed in Table 1.


