
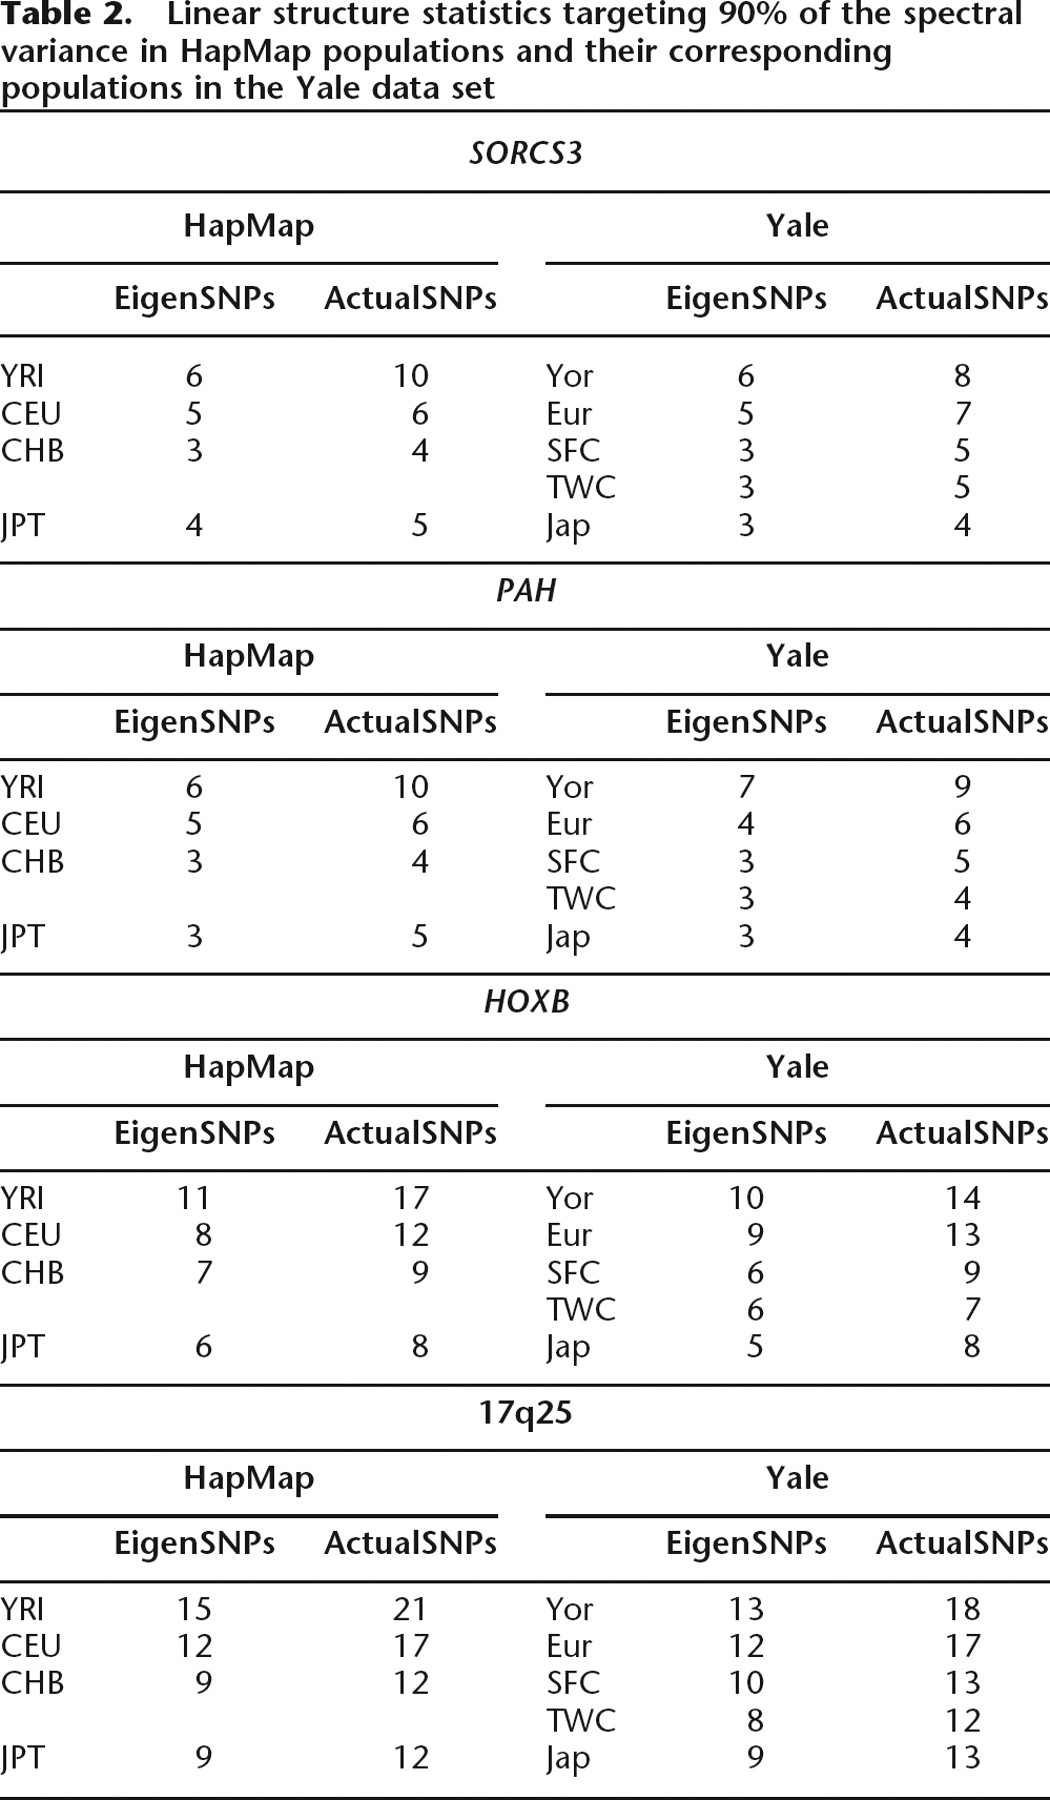
Table 2.
Linear structure statistics targeting 90% of the spectral variance in HapMap populations and their corresponding populations in the Yale data set
Click on table to view larger version.
Click on image to view larger version.
Linear structure statistics targeting 90% of the spectral variance in HapMap populations and their corresponding populations in the Yale data set
Click on table to view larger version.
 CiteULike
 Delicious
 Digg
Digg Facebook
 Google+
 Reddit
 Twitter
