
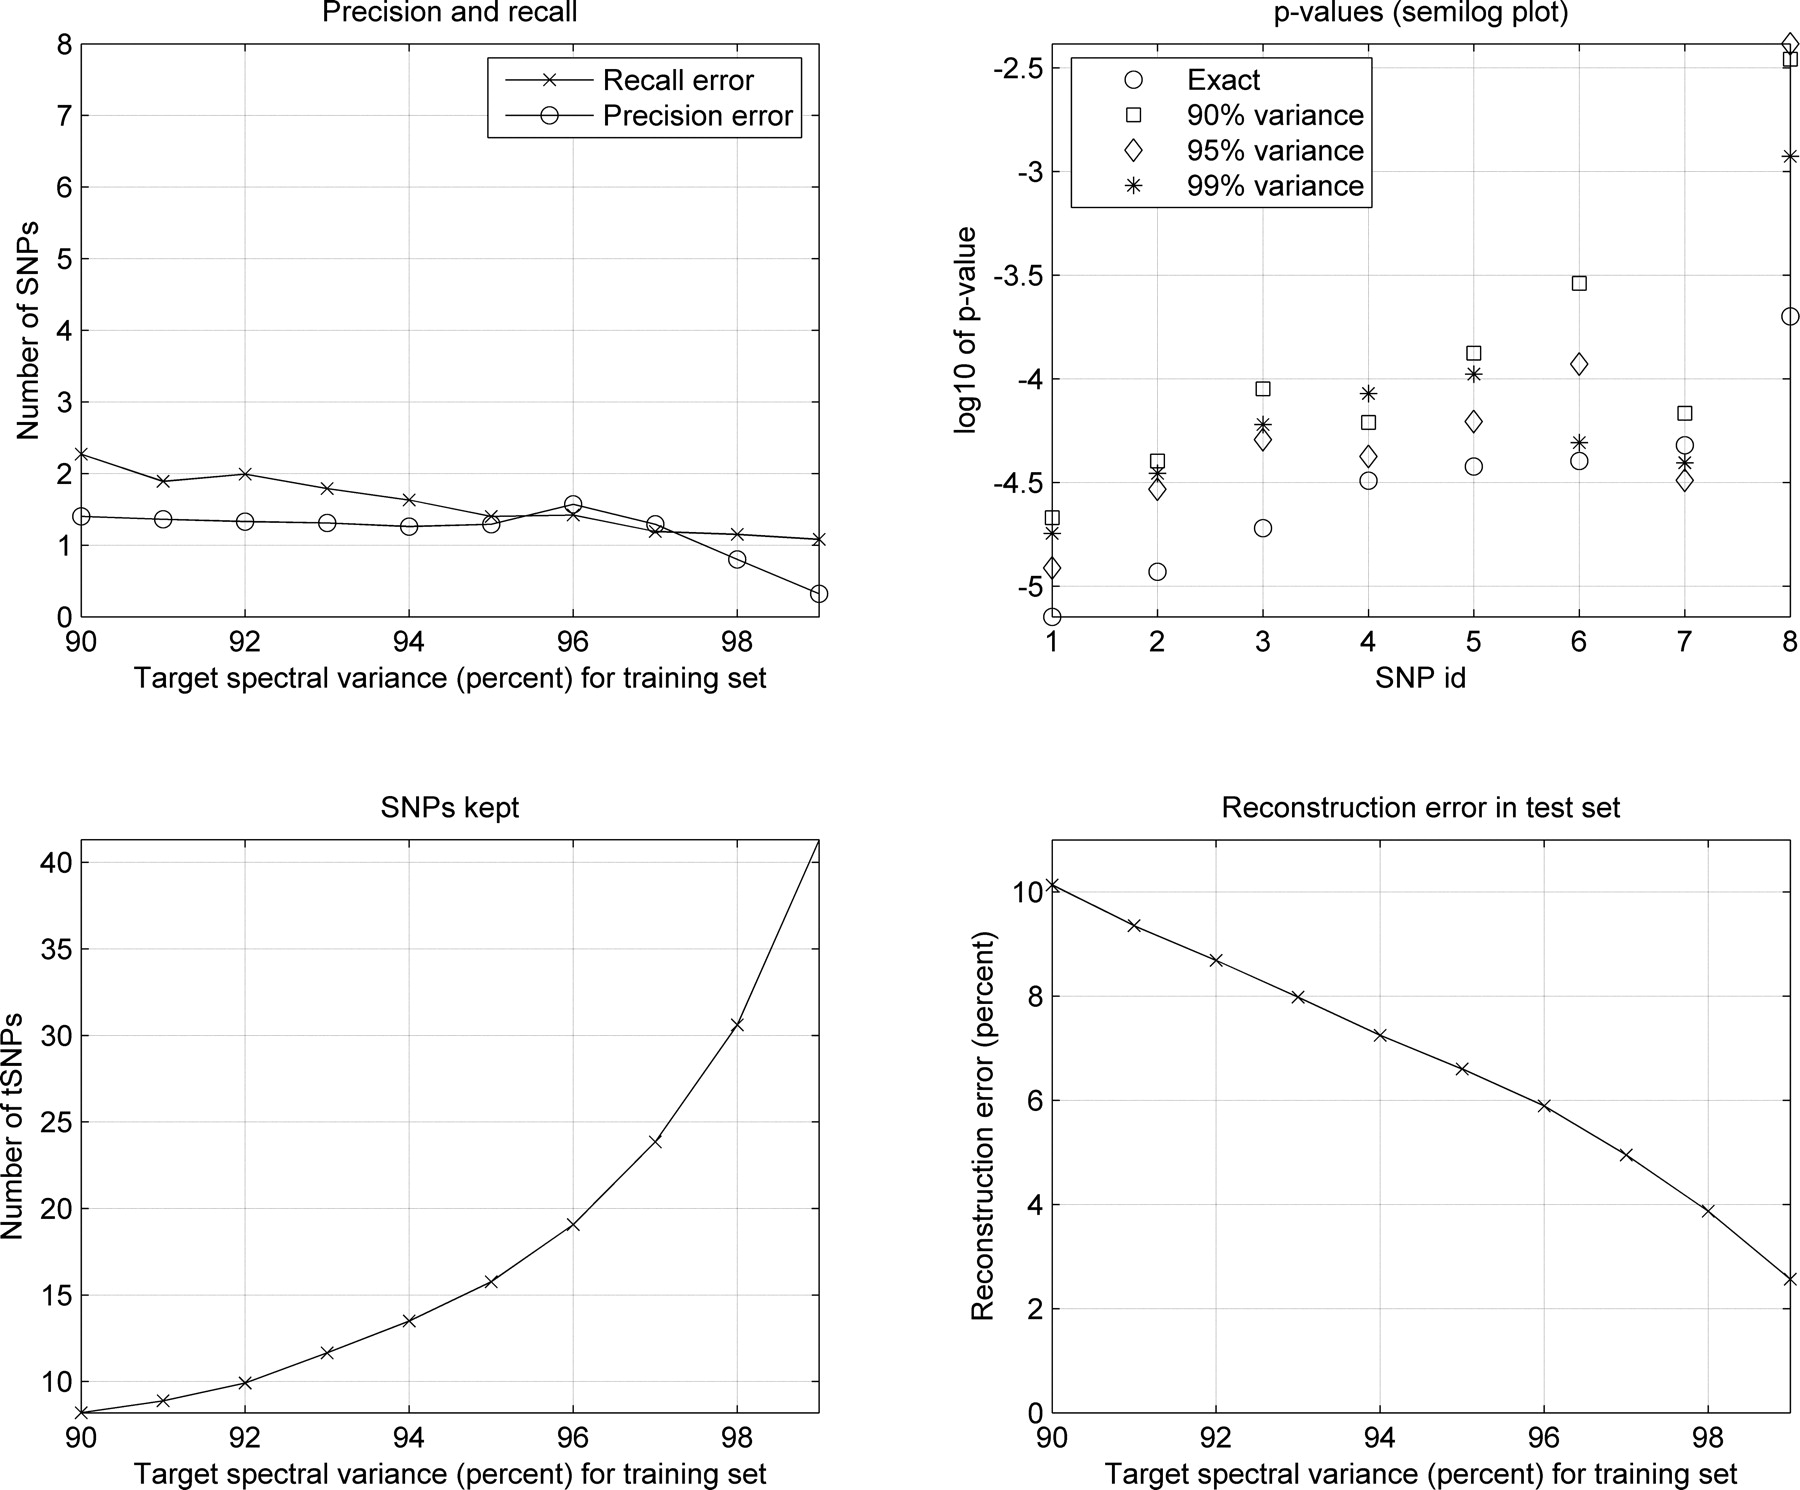
Genotype reconstruction for association analysis (50% training set). (Top, left) Number of SNPs for which the TDT on the reconstructed data set erroneously exceeded (false positives, precision curve) or failed to reach (false negatives, recall curve) the set threshold of significance P ≤ 2 × 10⁻⁴. (Top, right) P-values for each of the SNPs that were significantly associated with the disease in the original data set (SNP id 1: IGR2063b_1, 2: IGR2060a_1, 3: IGR2055a_1, 4: IGR2096a_1, 5: IGR3081a_1, 6: IGR3096a_1, 7: IGR2198a_1, 8: IGR3236a_1), and the corresponding TDT P-values in reconstructed data sets targeting 90%, 95%, and 99% of the training set spectral variance (log10 2 × 10⁻⁴ ≈ −3.7). (bottom left, right) Number of tSNPs selected targeting 90%–99% of the training set spectral variance and reconstruction error in the test set.


