
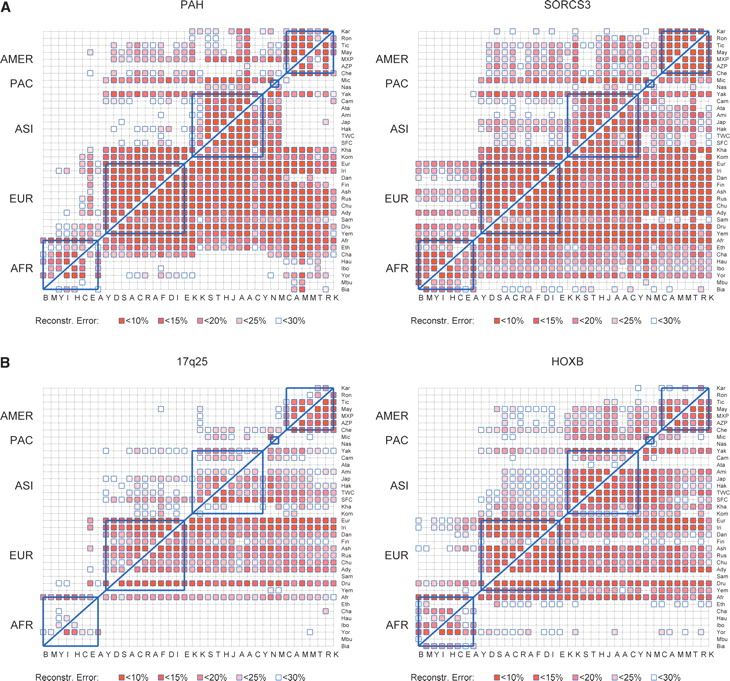
(A,B) Interpopulation reconstruction error (ratio of erroneously predicted entries over total number of predicted entries) for all pairs of populations. Populations are ordered (bottom to top and left to right) based on geographic regions (Africa, Europe, Asia, Micronesia, Americas). The (i, j)-th entry in the plot (i-th row, j-th column) corresponds to the reconstruction error for the j-th population, using the i-th population as reference. The SNPs to be assayed in the j-th population are determined by running the tSNPsMultiPassGreedy algorithm on the i-th population, seeking to explain 99% of the population's spectral variance. Blank entries correspond to reconstruction errors larger than 30%. The five geographic regions of our study are delimited by the blue boxes. (A) PAH and SORCS3; (B) 17q25 and HOXB.


