
Table 4.
Proportion of SNPs captured by ldSelect,  , and maxT (columns 3–5) for the genes indicated in column 1 when using the number of tags indicated in column 2
Click on table to view larger version.
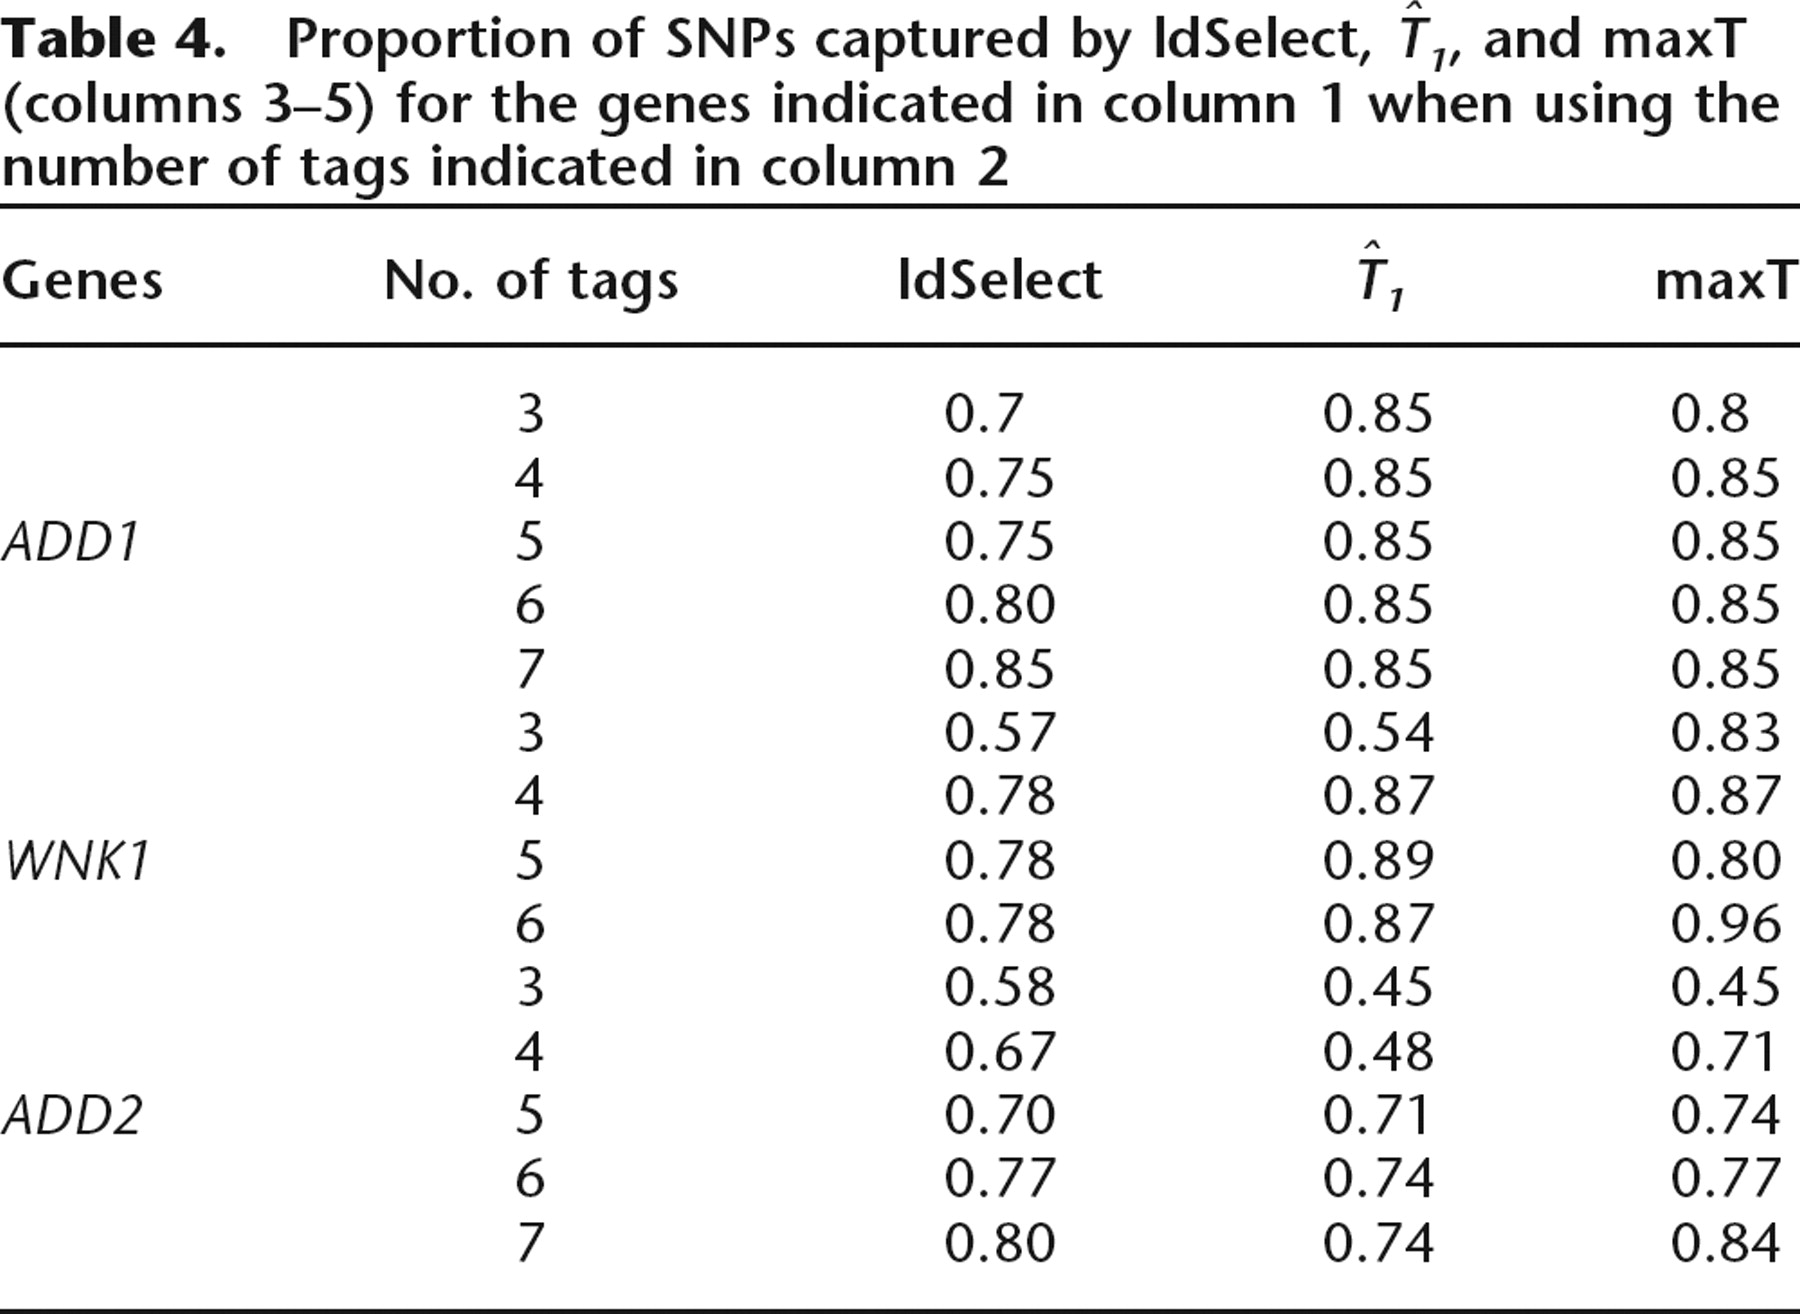
It is apparent that maxT is a better performer in the case that all subsets of a given size can be explored.


