
Table 1.
Proportion of SNPs captured averaged over the 10 ENCODE regions and 10 training-test splits
Click on table to view larger version.
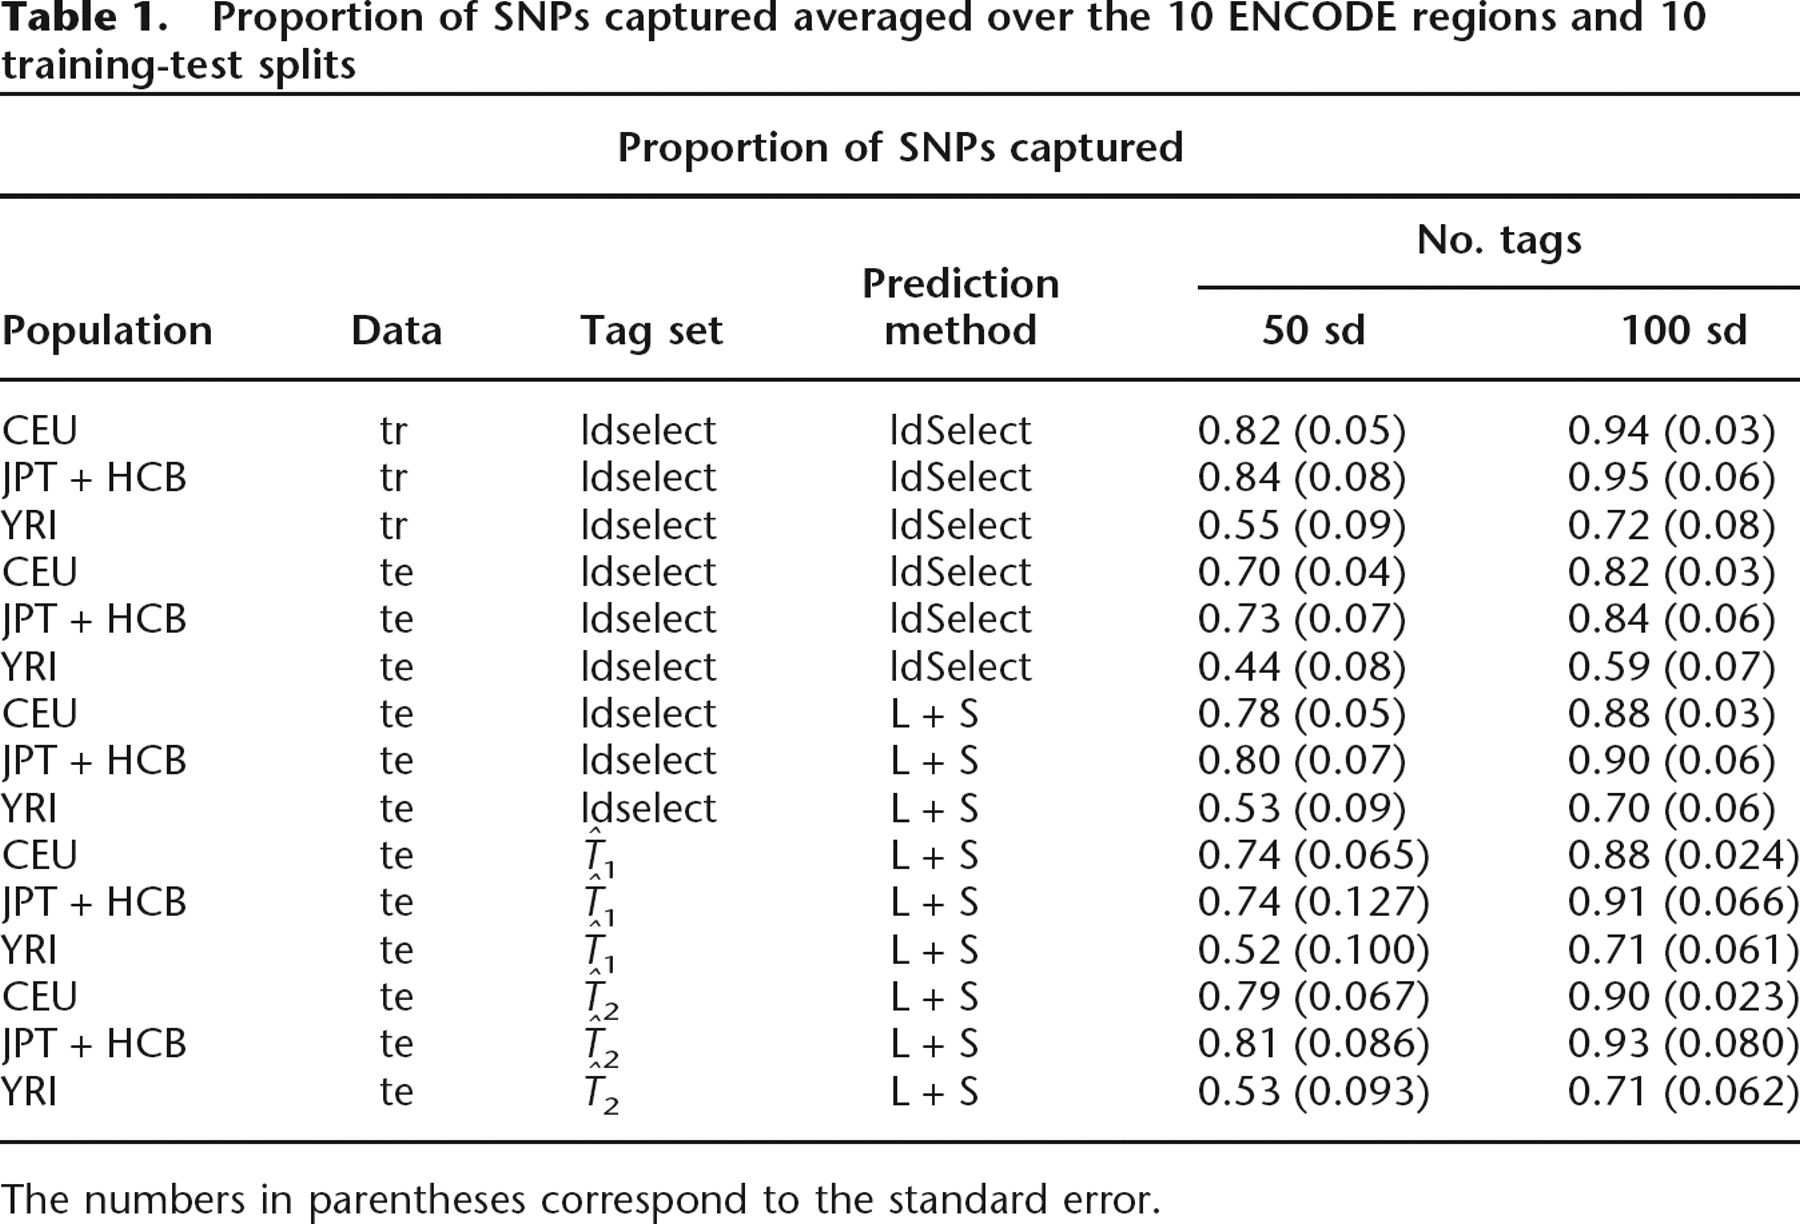
The numbers in parentheses correspond to the standard error.


