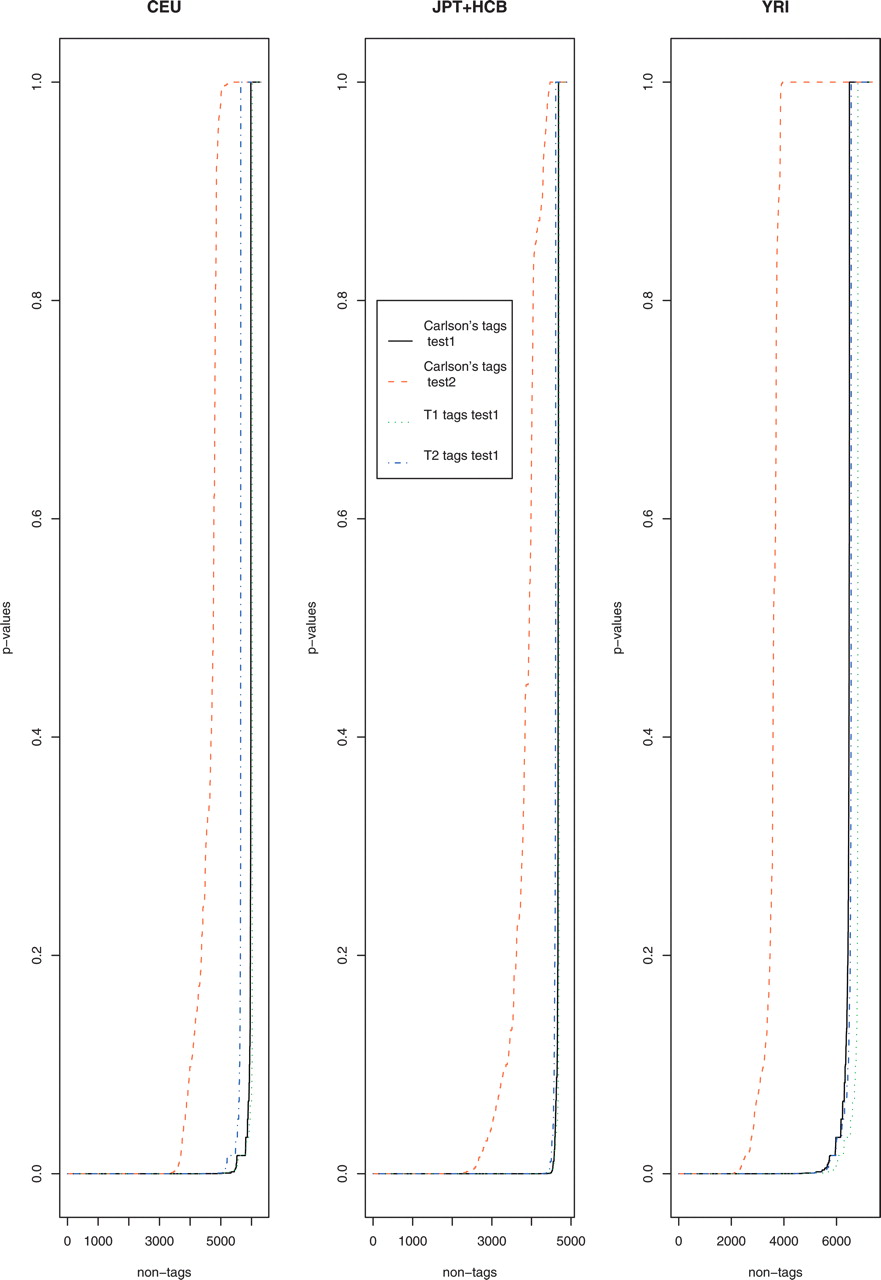
A model-based approach to capture genetic variation for future association studies

(Downloading may take up to 30 seconds. If the slide opens in your browser, select File -> Save As to save it.)

Click on image to view larger version.

Figure 1.
Figure 1.

Sorted P-values of Fisher’s exact test (test1) in the three populations CEU (left), JPT+HCB (middle), and YRI (right) evaluated in test data in the 10 ENCODE regions.

This Article

  1. Genome Res. 17: 88-95

Preprint Server