
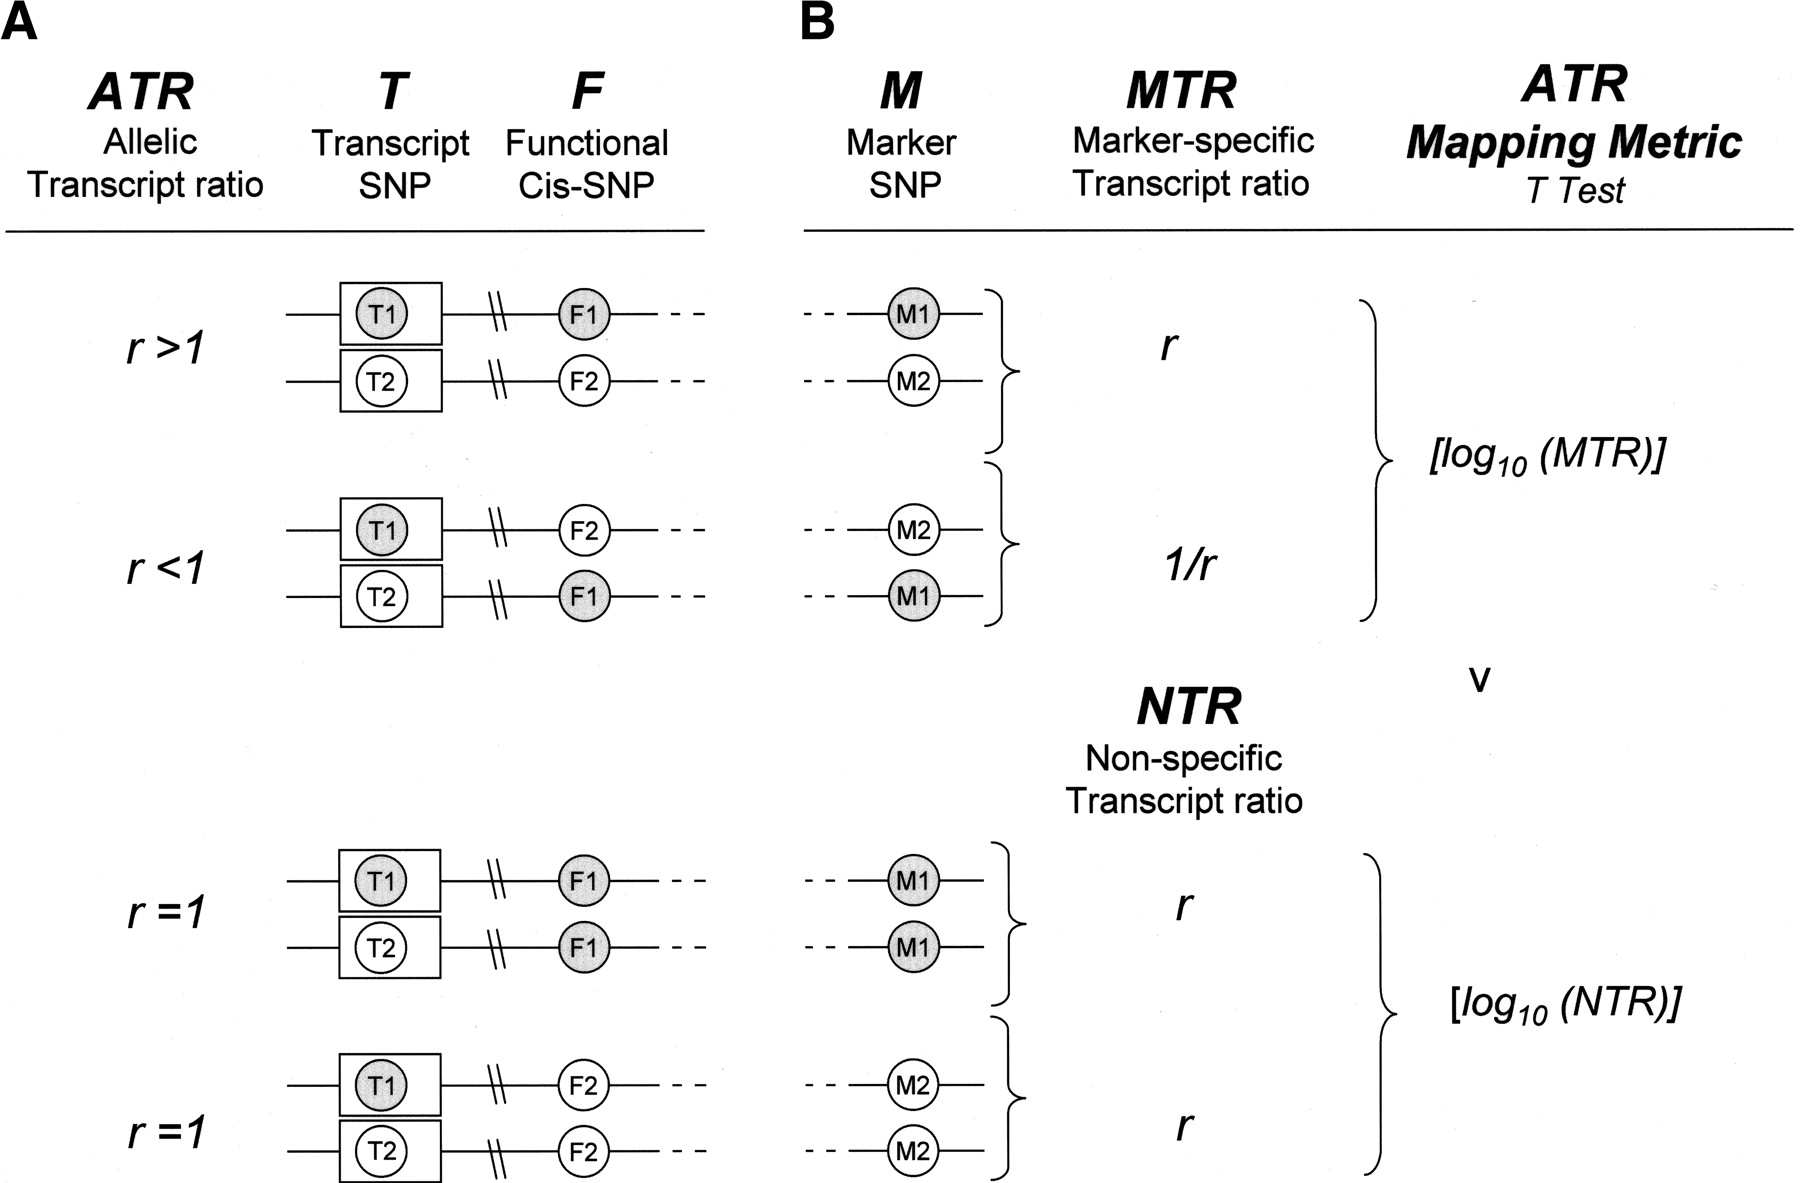
(A) If a cis-acting polymorphism F is heterozygous, the observed ATR at transcript Marker T will be expected to deviate from 1. The direction of ATR deviation in a given cell line will depend on the phase relationship between F and T. In the example shown in A, allele F1 up-regulates gene expression. The observed ATR, T1:T2, is therefore >1 when it represents F1:F2 and <1 when it represents F2:F1. (B) In individuals who are heterozygous for M, the ATR is phase-corrected with respect to M so that in all cases it represents the relative abundance of transcripts derived from the M1 chromosome compared to the M2 chromosome. We call the phase-corrected ATR the marker-specific transcript ratio (MTR) and for a marker SNP M in high LD with the functional SNP F, but in low LD with the transcript SNP T, MTR values will cluster where ATR values may not. In individuals who are homozygous for M, ATR values provide a measure of experimental variation that cannot be attributed to the allele-specific effects of M. We call this the non-specific transcript ratio (NTR). The ATR Mapping Metric is a two-tailed t-test with unequal variance for the comparison ATR values in the two groups MTR and NTR. The Log10s of all ATR values are used in the t-test. A significant P-value implies that the variation seen in the observed ATR is attributable to the allele-specific effects at M.


