
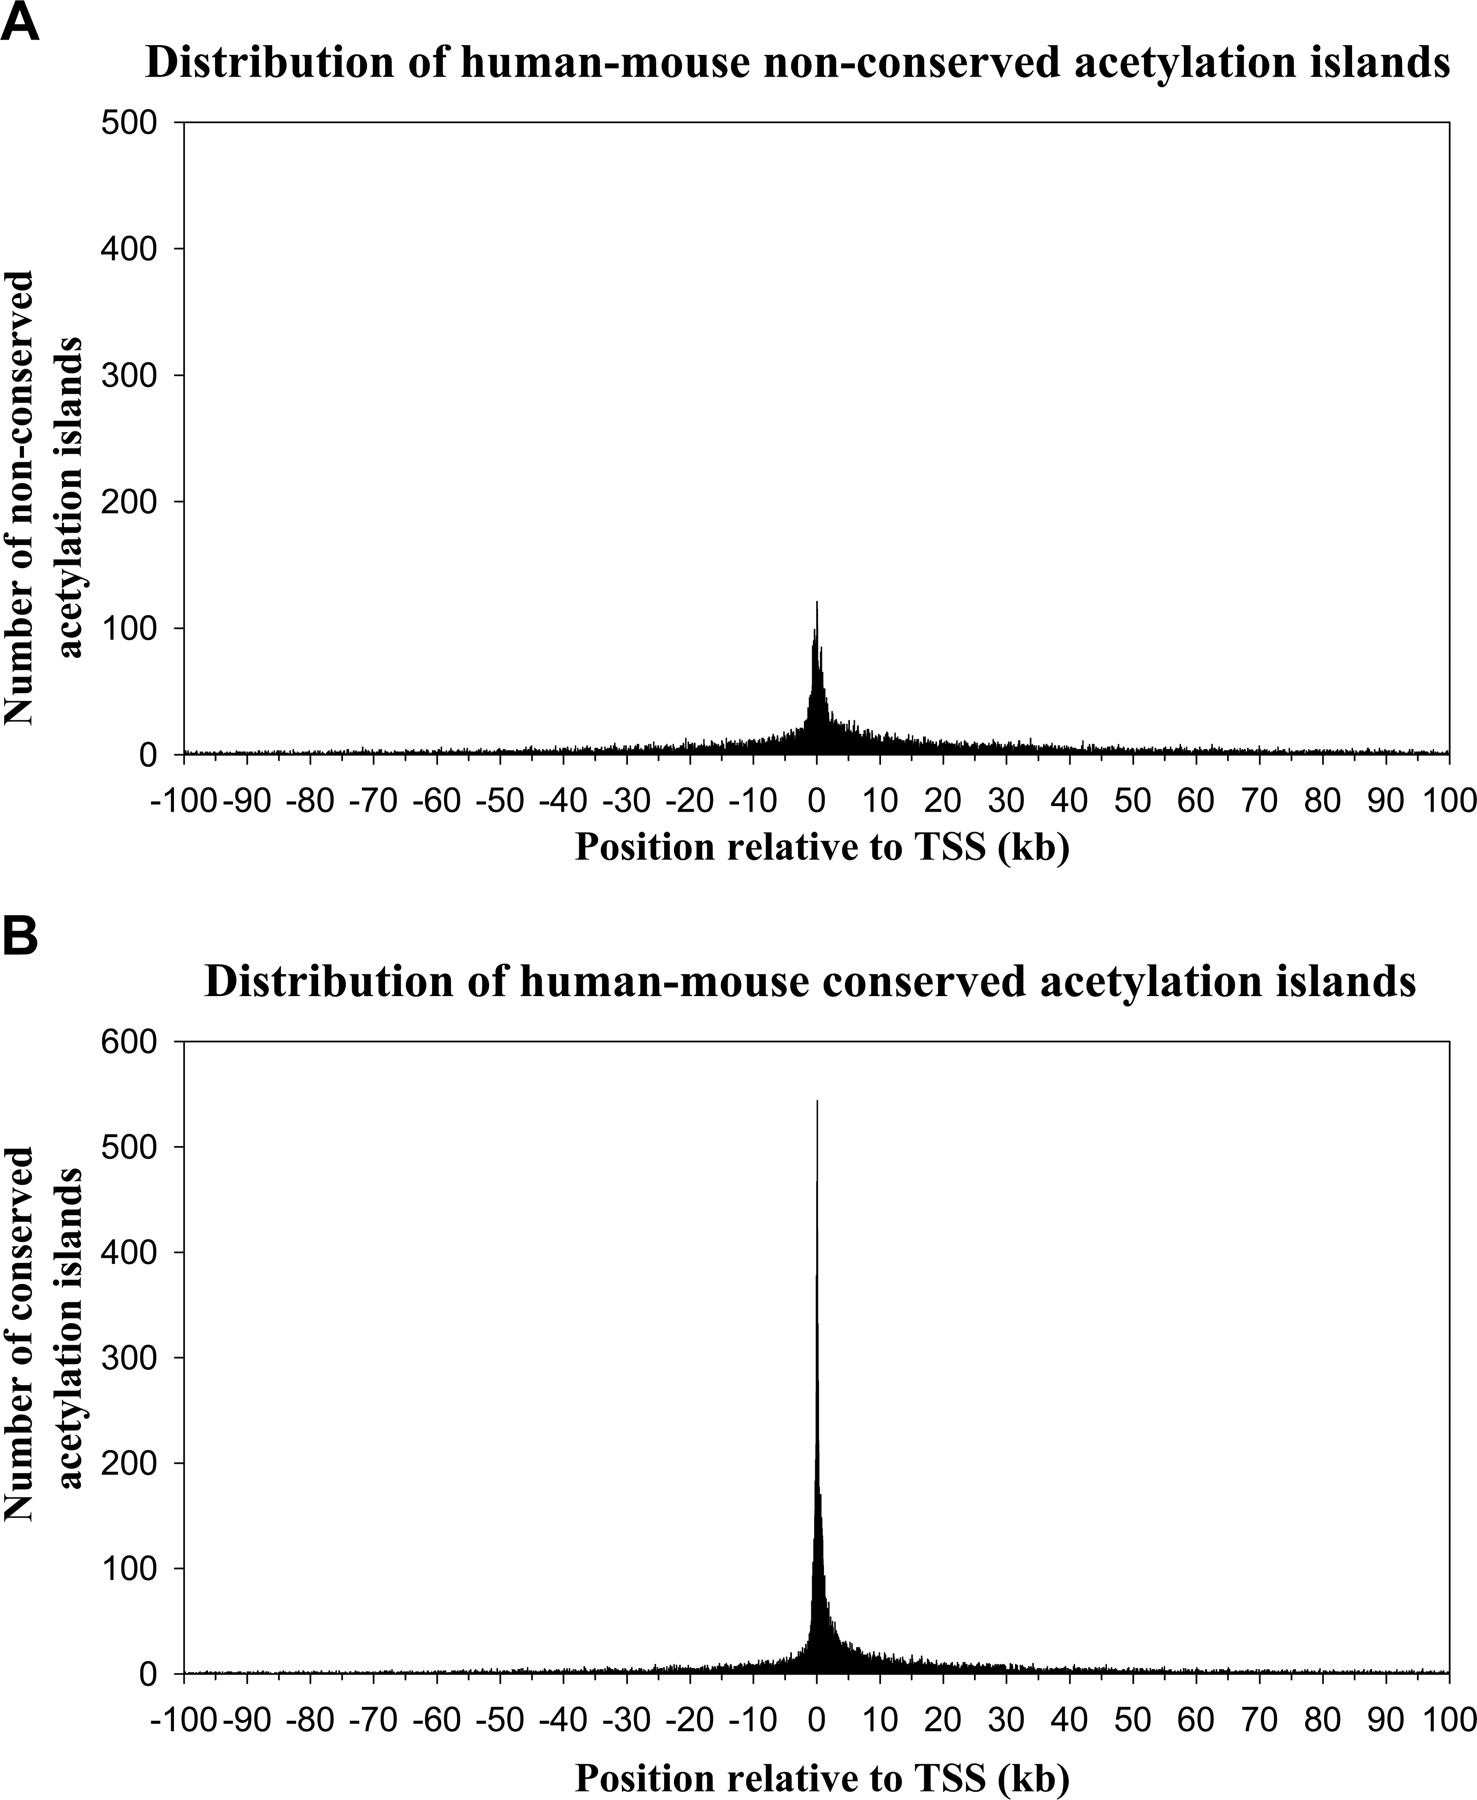
Figure 2.
The distribution of human–mouse conserved and nonconserved histone acetylation island sequences. (A) The distribution of 19,070 nonconserved acetylation island sequences is plotted relative to their location within 100 kb of the nearest RefSeq TSS. The y-axis indicates the number of sequences (50-bp window sizes) found ±100 kb from a TSS. (B) The distribution of 22,796 human–mouse conserved acetylation island sequences is plotted as in A.


