
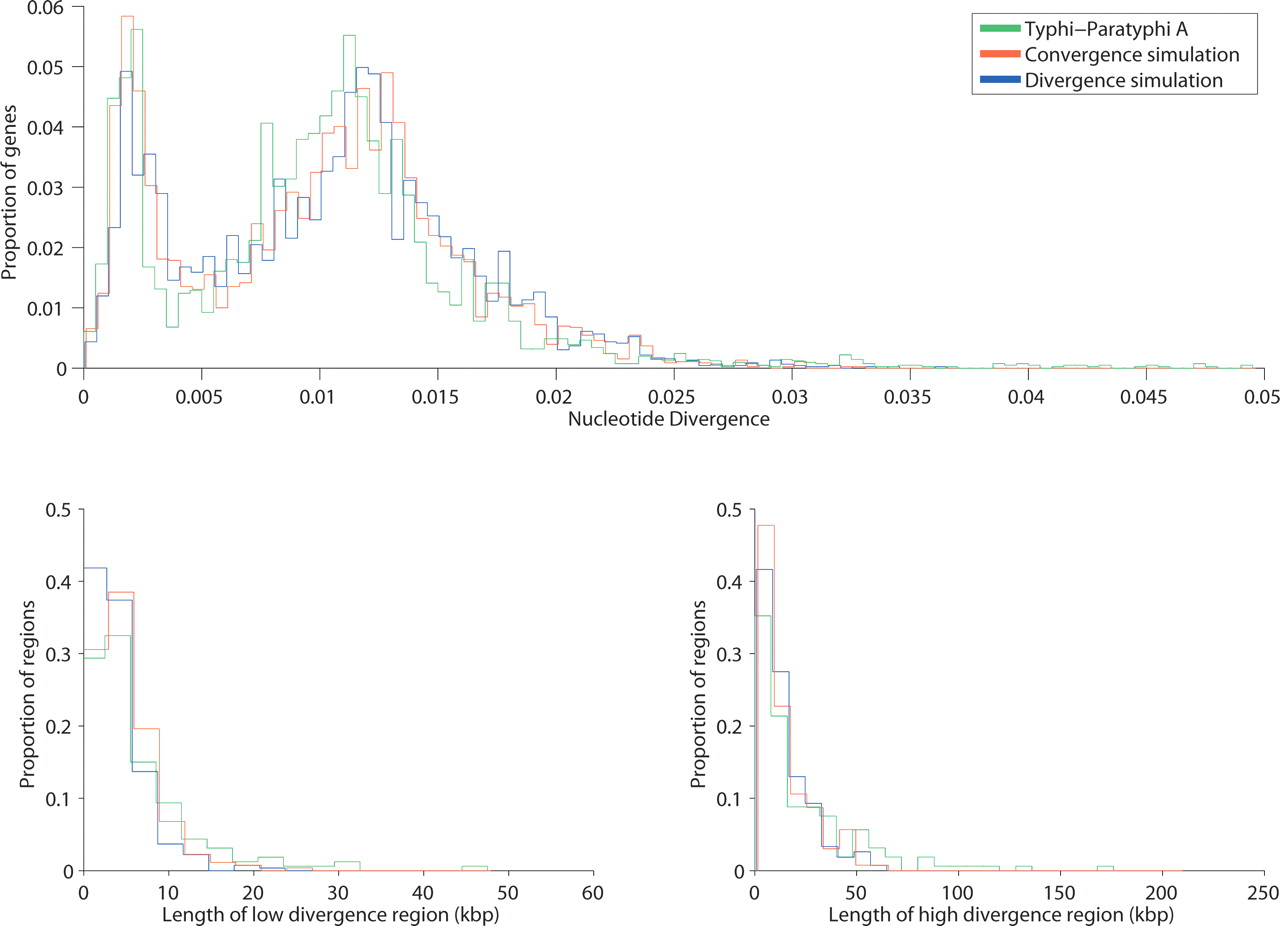
Figure 5.
Properties of low- and high-divergence regions in Typhi vs. Paratyphi A, compared with genomes simulated according to convergence and divergence scenarios.
(Downloading may take up to 30 seconds. If the slide opens in your browser, select File -> Save As to save it.)
Click on image to view larger version.
Properties of low- and high-divergence regions in Typhi vs. Paratyphi A, compared with genomes simulated according to convergence and divergence scenarios.
 CiteULike
 Delicious
 Digg
Digg Facebook
 Google+
 Reddit
 Twitter
