
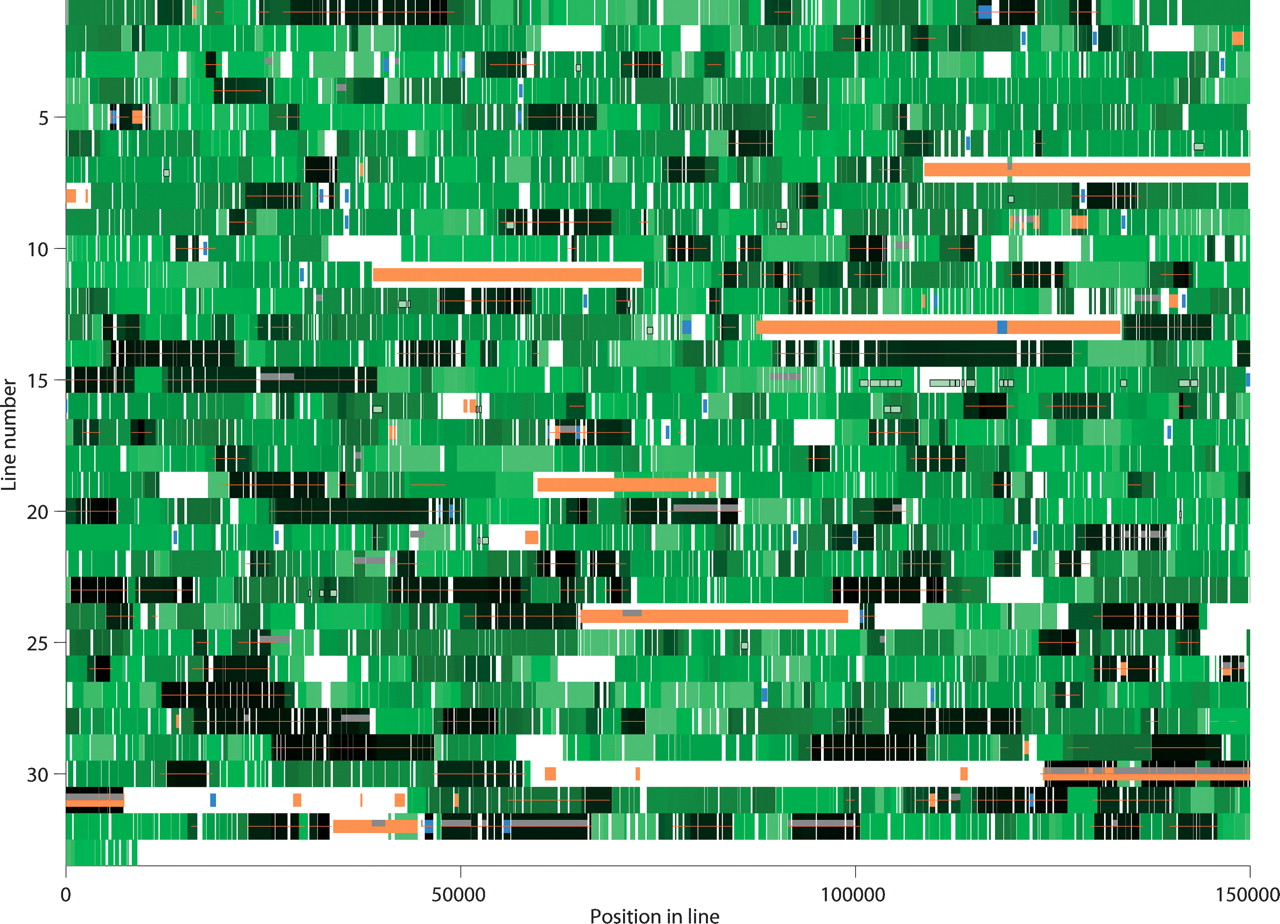
Divergeome of Typhi in comparison with Paratyphi A. The Typhi genome is shown in 32 lines of 150 kb each and one line of 9037 bp. The starting point is as published in Parkhill et al. (2001). Each gene is color-coded by divergence level in green, as in Figure 1D. Regions where Paratyphi A does not align are shown in white. The low-divergence regions are indicated by a red line. Phage genes are shown in orange, transposase genes in blue, and rare genes in gray. Genes for which Typhi is <0.3% diverged at the nucleotide level to one of the seven test genomes are shown as white boxes with black frames. A full list of genes and their positions is shown in Supplemental Table S4. An equivalent divergeome for Paratyphi A is shown in Supplemental Fig. S2.


