
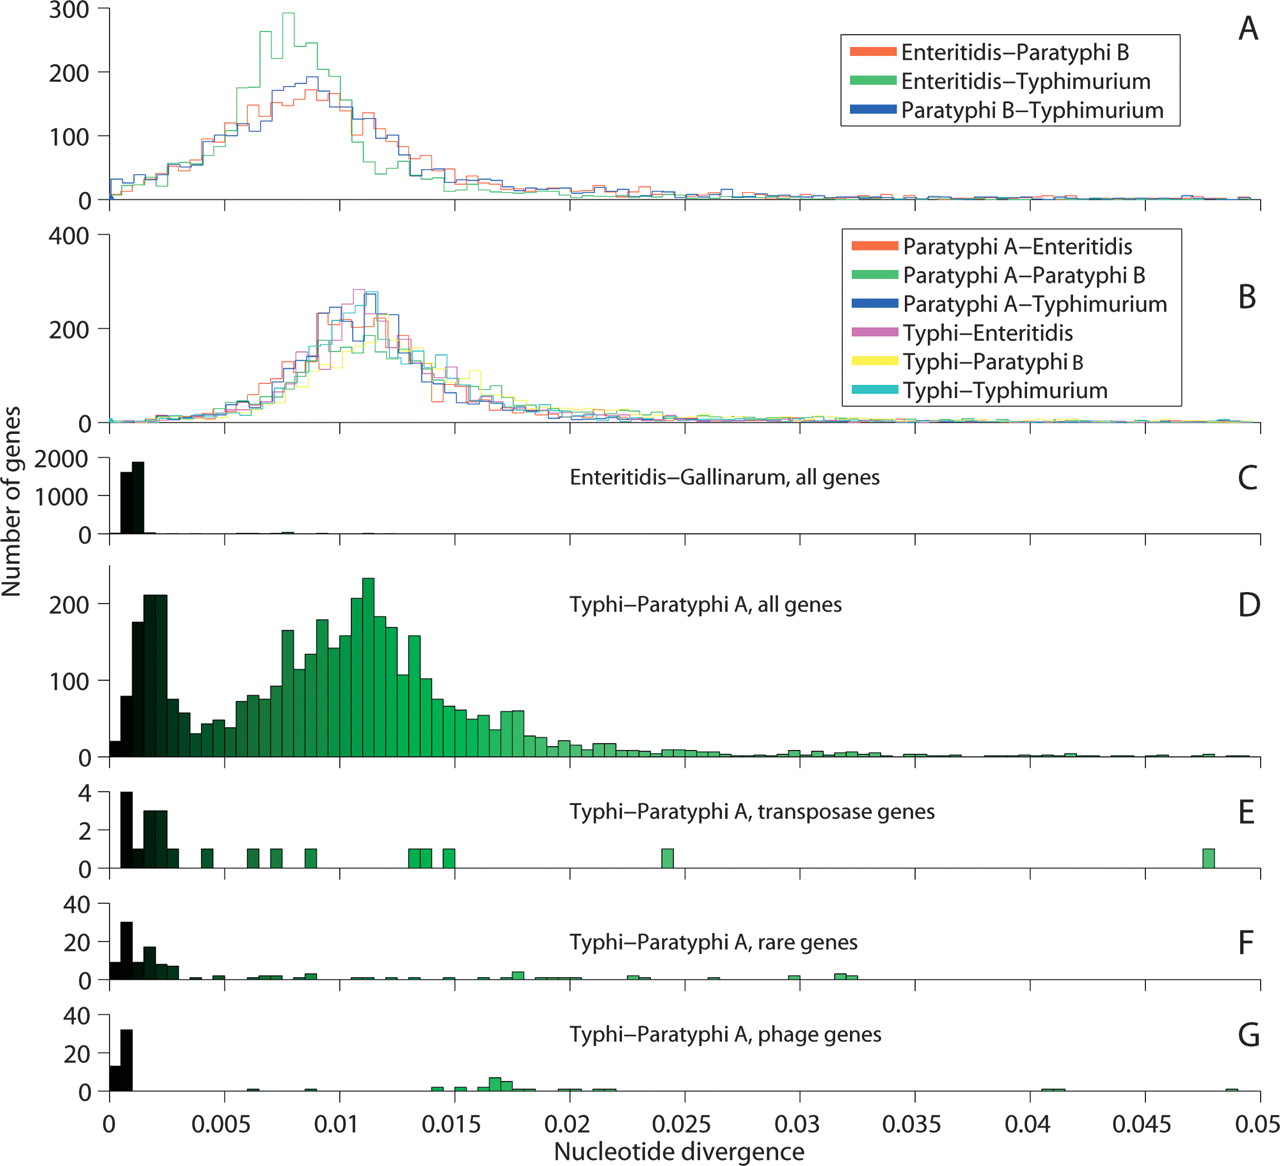
Figure 1.
Gene-by-gene divergence levels between pairs of genomes of Salmonella enterica. The histograms show the distribution of divergence levels for each gene as estimated by the changepoint model. The intensity of green is proportional to the divergence level up to 2% and is used in Figure 2. Pairwise comparisons, showing respectively unrelated S. enterica genomes excluding Typhi or Paratyphi A (A), the same genomes with Typhi and Paratyphi A (B) and of the closely related Enteritidis and Gallinarum genomes (C). The Typhi versus Paratyphi A comparison showing all genes (D) and homologous transposase genes (E), rare genes (F), and phage genes (G).


