
Calculation of P-values for informative sites for recombination in reference strain Da/TW-448 and clinical isolates G/CL-4 and Ja/CL-10 based on SimPlot data in Figure 6
Click on table to view larger version.
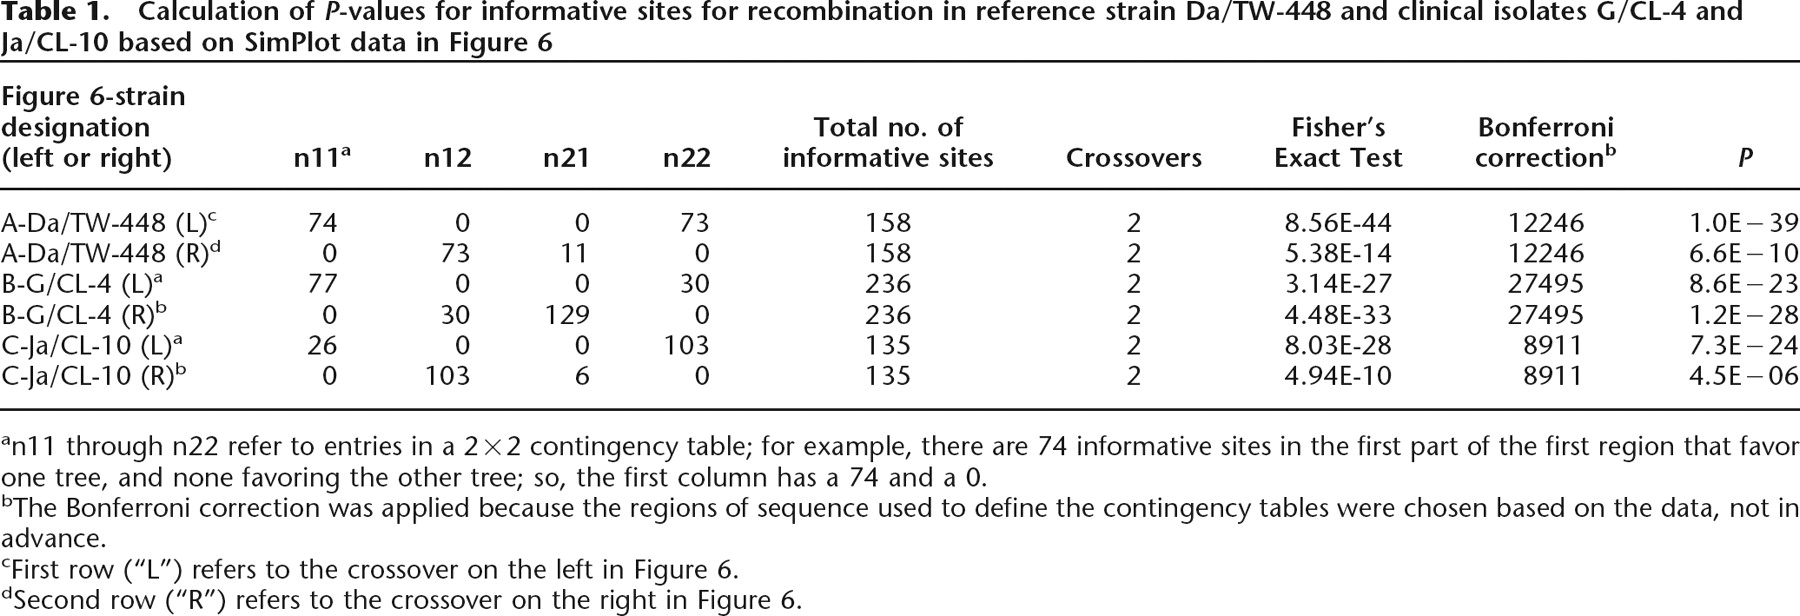
an11 through n22 refer to entries in a 2×2 contingency table; for example, there are 74 informative sites in the first part of the first region that favor one tree, and none favoring the other tree; so, the first column has a 74 and a 0.
bThe Bonferroni correction was applied because the regions of sequence used to define the contingency tables were chosen based on the data, not in advance.
cFirst row (“L”) refers to the crossover on the left in Figure 6.
dSecond row (“R”) refers to the crossover on the right in Figure 6.


