
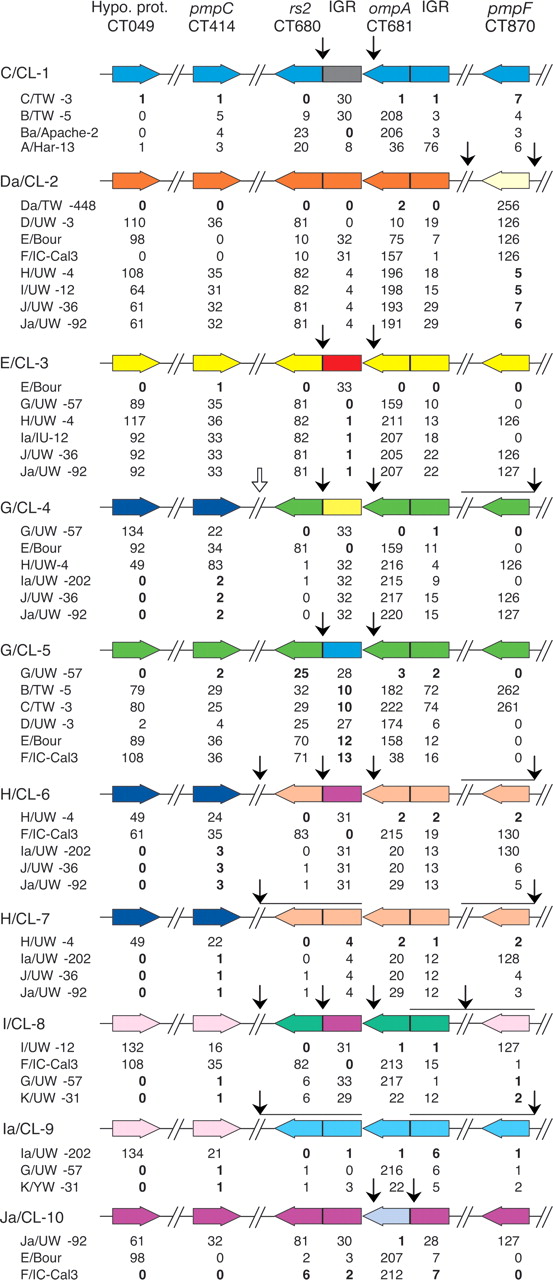
Linear representation of the proposed chromosomal mosaics for C. trachomatis clinical isolates. The seven loci are represented by colored boxed arrows, which show the coding strand direction of each gene. The vertical arrows represent the deduced crossovers (arrows between noncontiguous sequences) and statistically confirmed hotspots for recombination (arrows between rs2 and the rs2/ompA IGR, and between ompA and the rs2/ompA IGR). The open arrow represents a putative crossover for G/CL-4 as the assignment of rs2 is ambiguous for this isolate. Horizontal lines under arrows that represent deduced crossovers denote the potential area over which the crossover may occur. The chart below each color scheme shows the genetic distance (based on number of nucleotide differences) between the clinical isolate and the reference strain lineages that are likely involved in the mosaic, noted in bold.


