
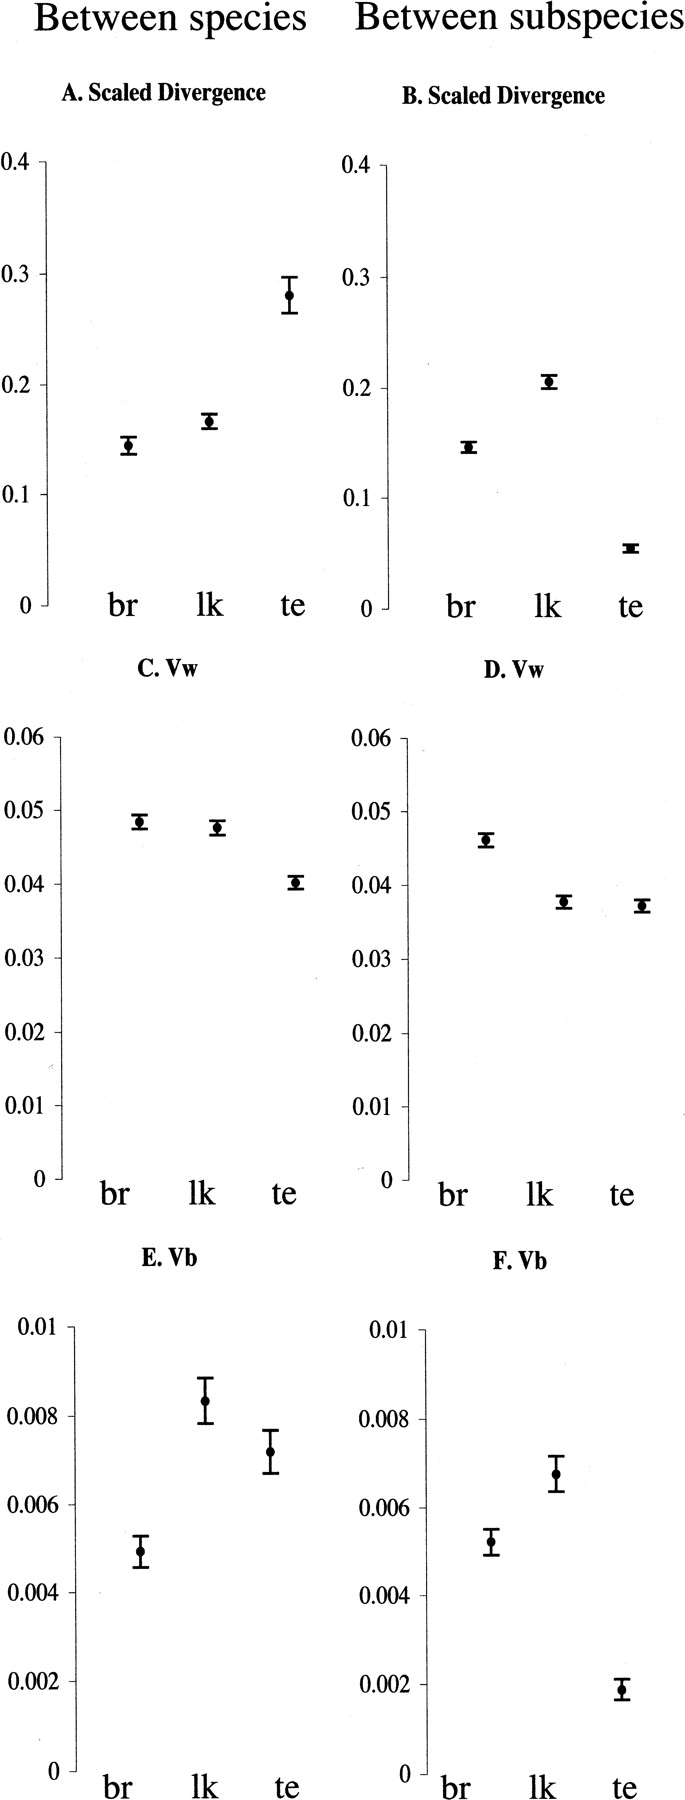
Figure 3.
Mean and 95% confidence interval of scaled divergences, Vw and Vb. (A,C,E) Between Mus spretus and the combined subspecies of Mus musculus. (B,D,F) Between subspecies of M. musculus. br indicates brain; lk, liver/kidney; and te, testis


