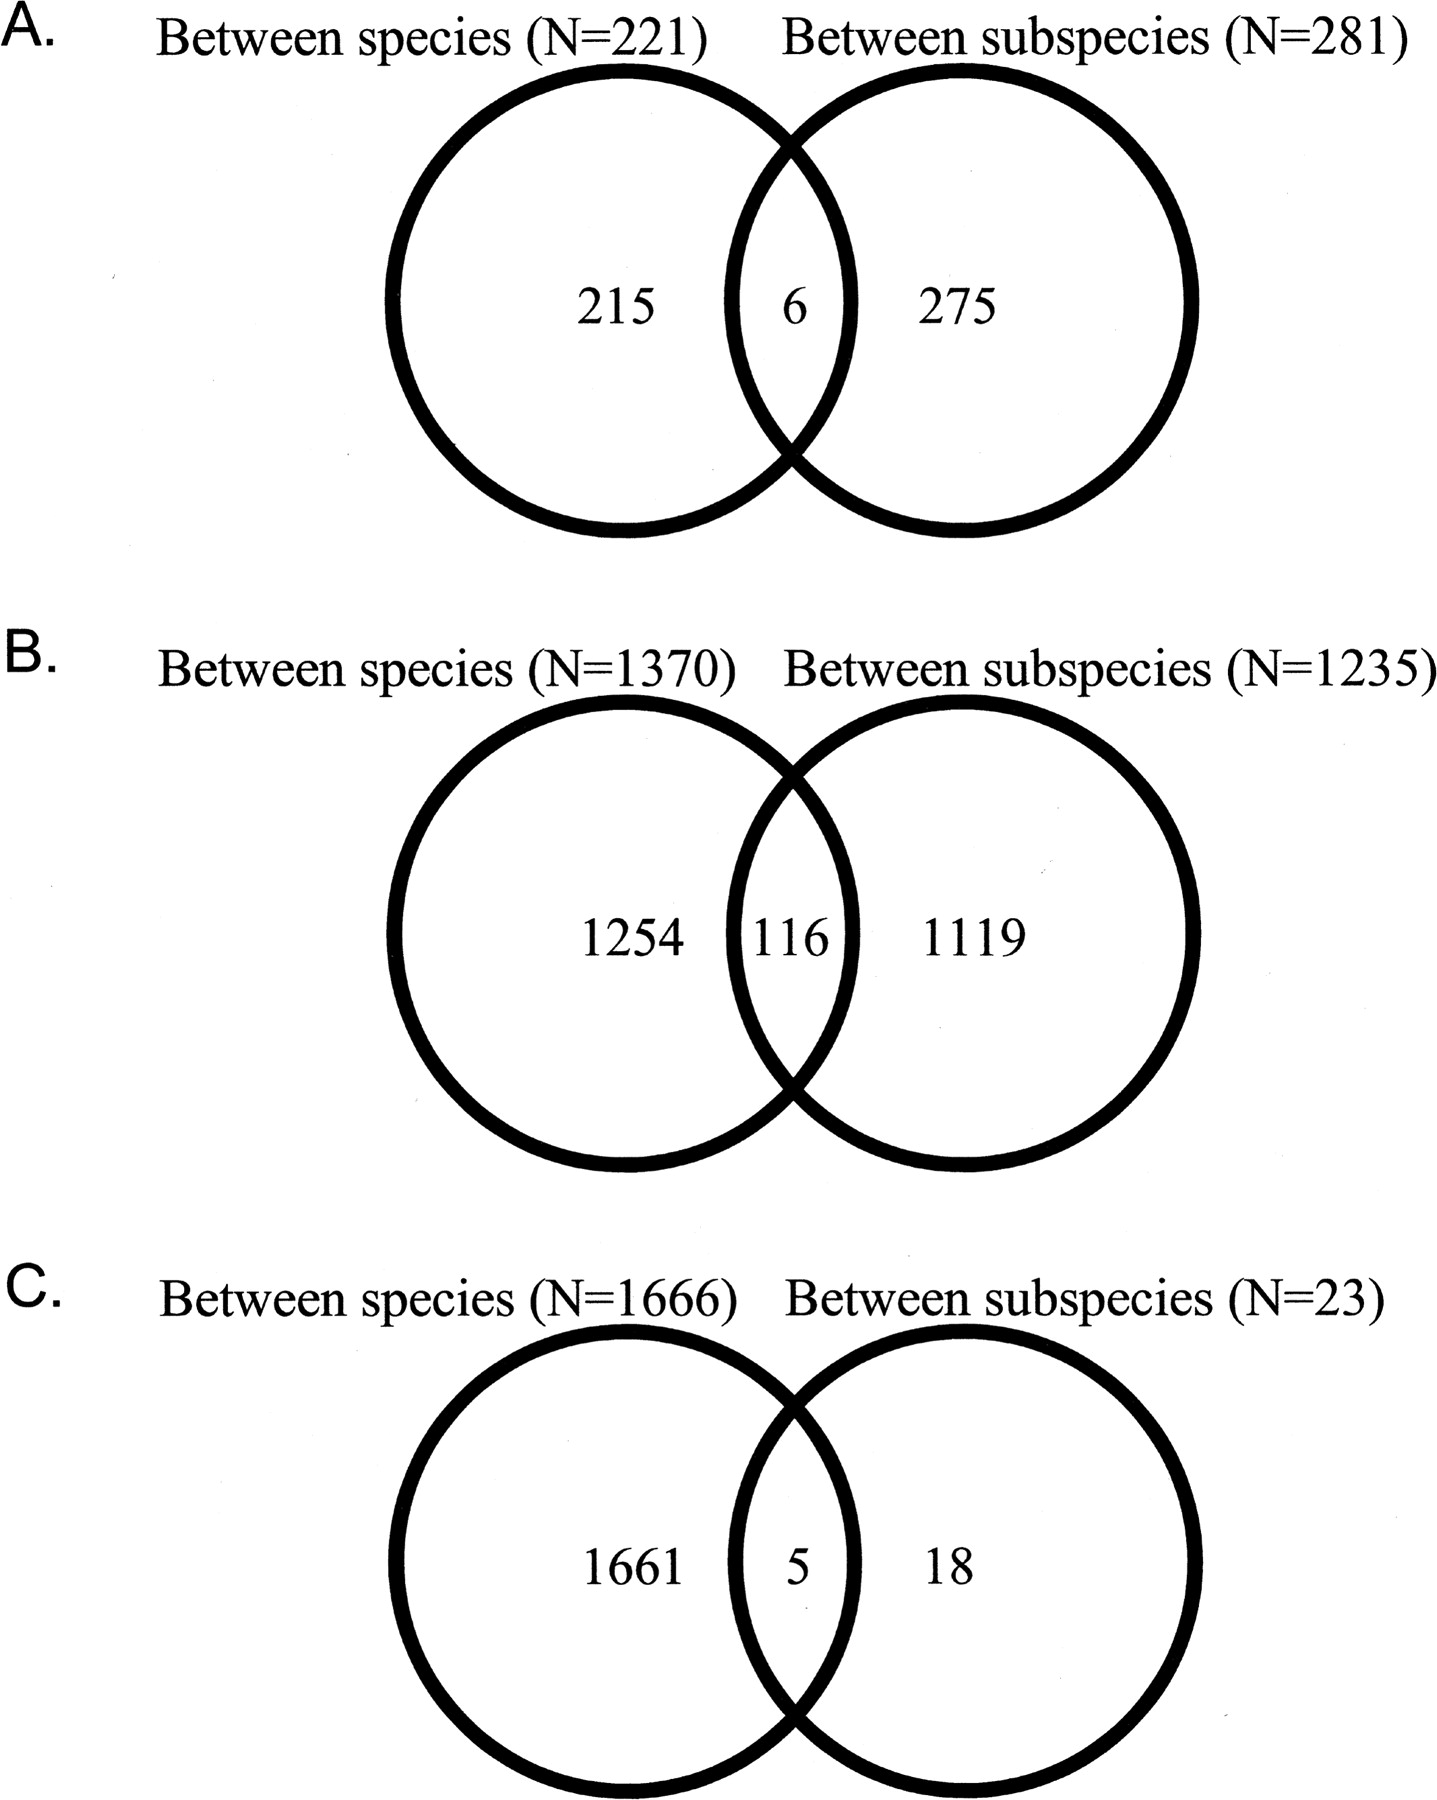
Contrasting evolution of expression differences in the testis between species and subspecies of the house mouse

(Downloading may take up to 30 seconds. If the slide opens in your browser, select File -> Save As to save it.)

Click on image to view larger version.

Figure 2.
Figure 2.

Venn diagram showing the number and overlap of genes differentially expressed (FDR < 5%) between species and between subspecies. (A) Brain, (B) liver/kidney, (C) testis.

This Article

  1. Genome Res. 17: 42-49

Preprint Server