
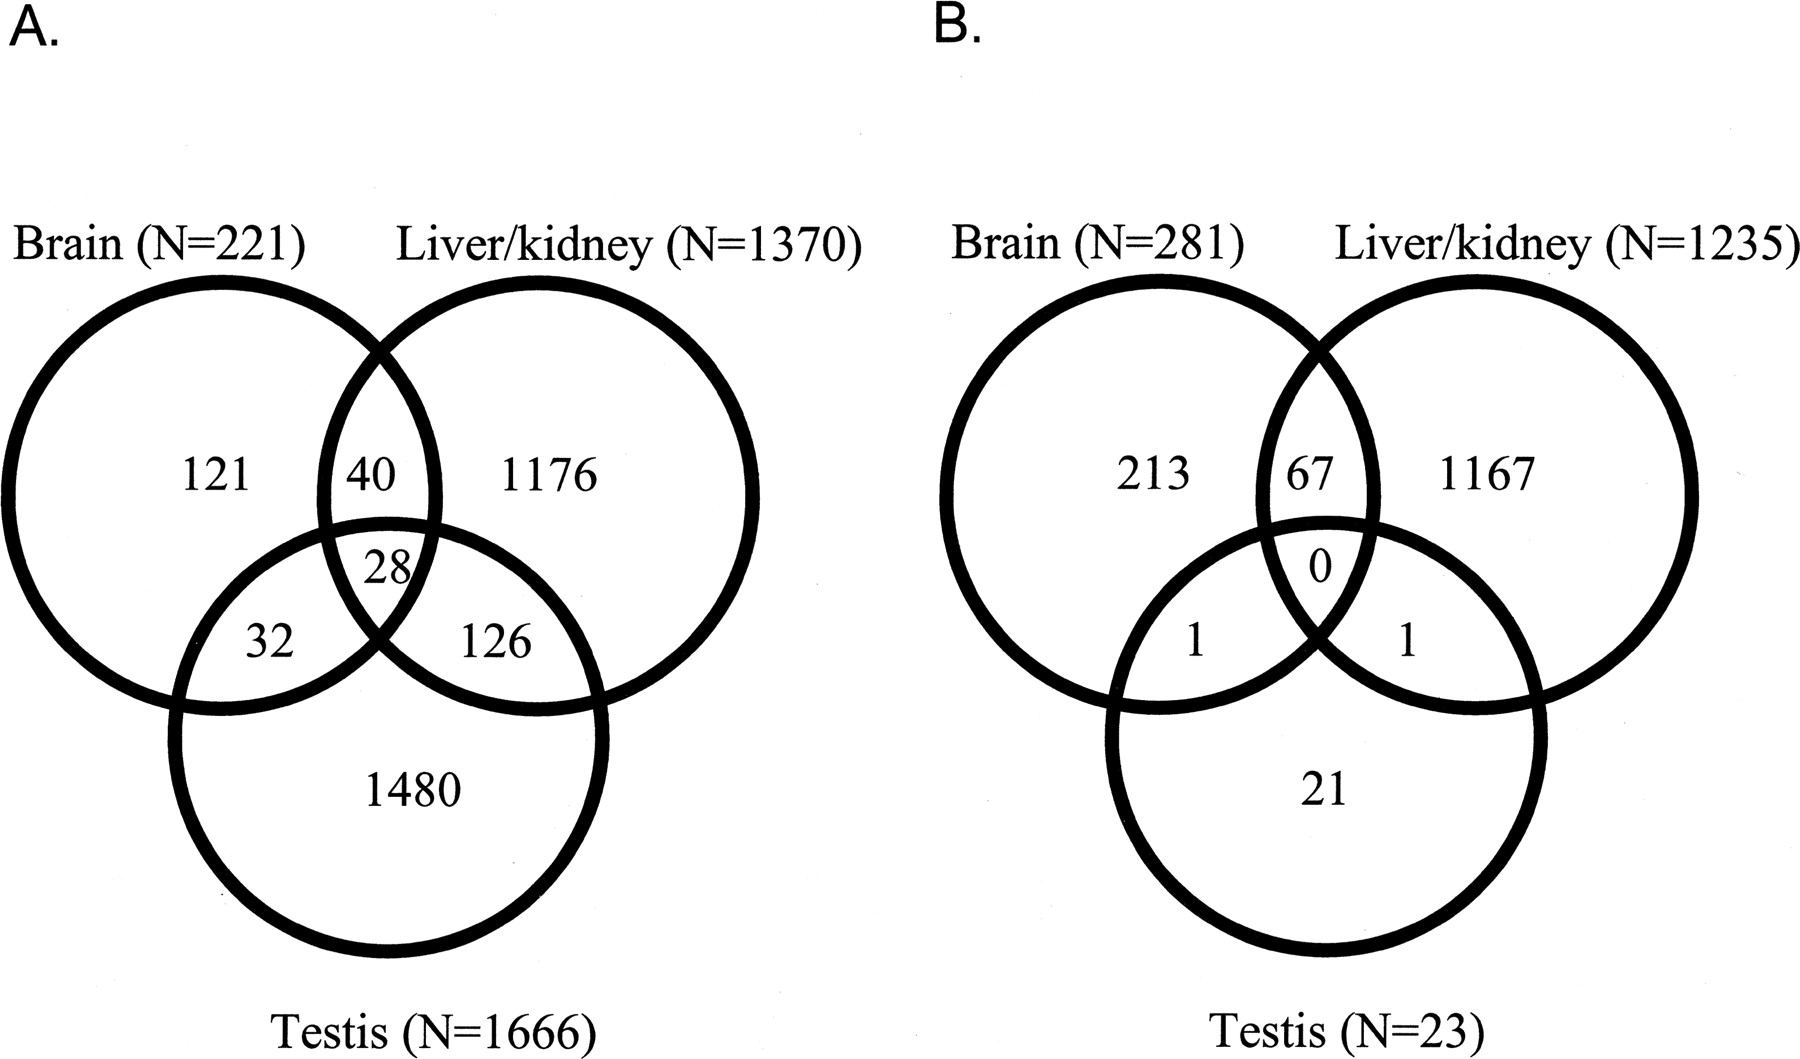
Figure 1.
(A) Venn diagram showing the number of genes differentially expressed between Mus musculus and Mus spretus (FDR < 5%) in the different tissues and the overlap of genes between different tissues. (B) Venn diagram showing the number of genes differentially expressed between M. musculus subspecies (FDR < 5%) in the different tissues and the overlap of genes between different tissues.


