
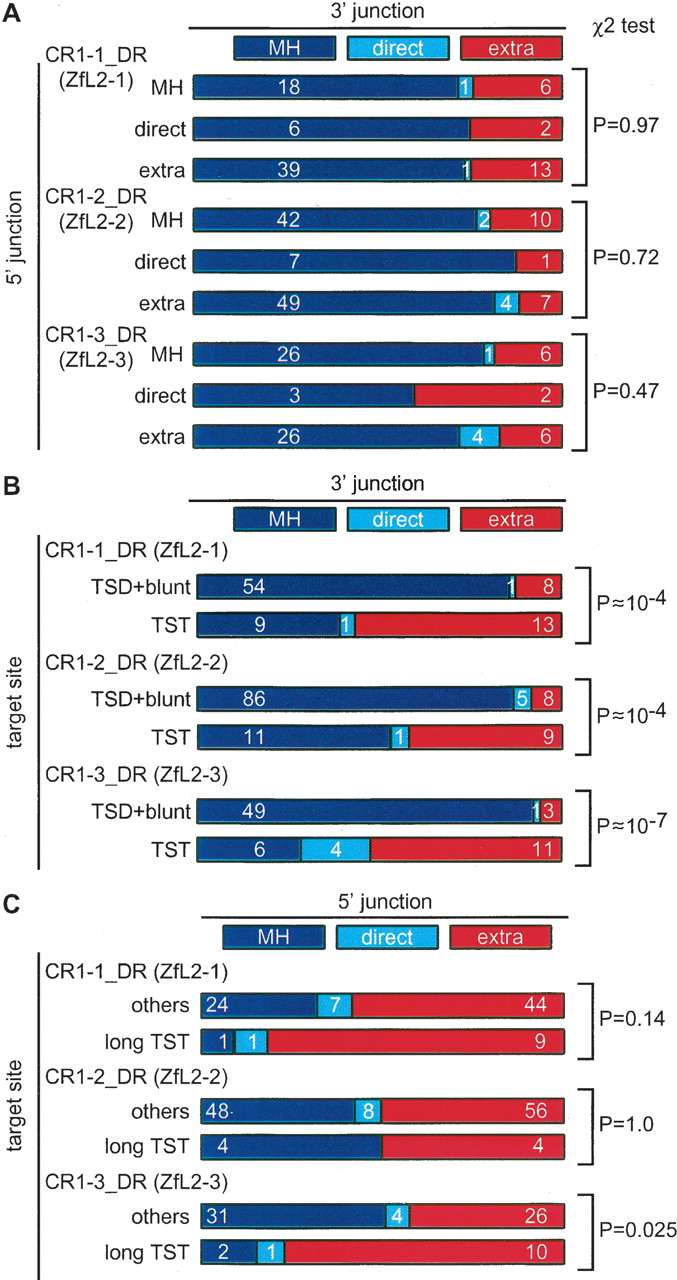
Two-dimensional matrix analysis for the interrelatedness of the junction features. (A) 5′ junction vs. 3′ junction. Integrants are categorized into those having MH, direct joining (direct), or extra nucleotides (extra) at the 5′ junction. In each category, integrants are further categorized into those having MH (blue), direct joining (light blue), and extra nucleotides (red) at the 3′ junction. The number of copies collected is indicated inside each rectangle and the P values by χ2 tests of independence are shown at the right. (B) Target-site alterations vs. 3′ junction. Integrants are categorized into those with TSTs and the others (TSD+blunt), and further categorized by their 3′ features. The number of copies collected is indicated inside each rectangle. (C) Target-site alterations vs. 5′ junction. Integrants are categorized into those with long TSTs or others (short TSTs, TSDs, or blunt insertion), and further categorized by their 5′ features. The number of copies collected is indicated inside. Integrants with MH and those joined directly were combined for the χ2 analysis to enhance the power of validation.


