
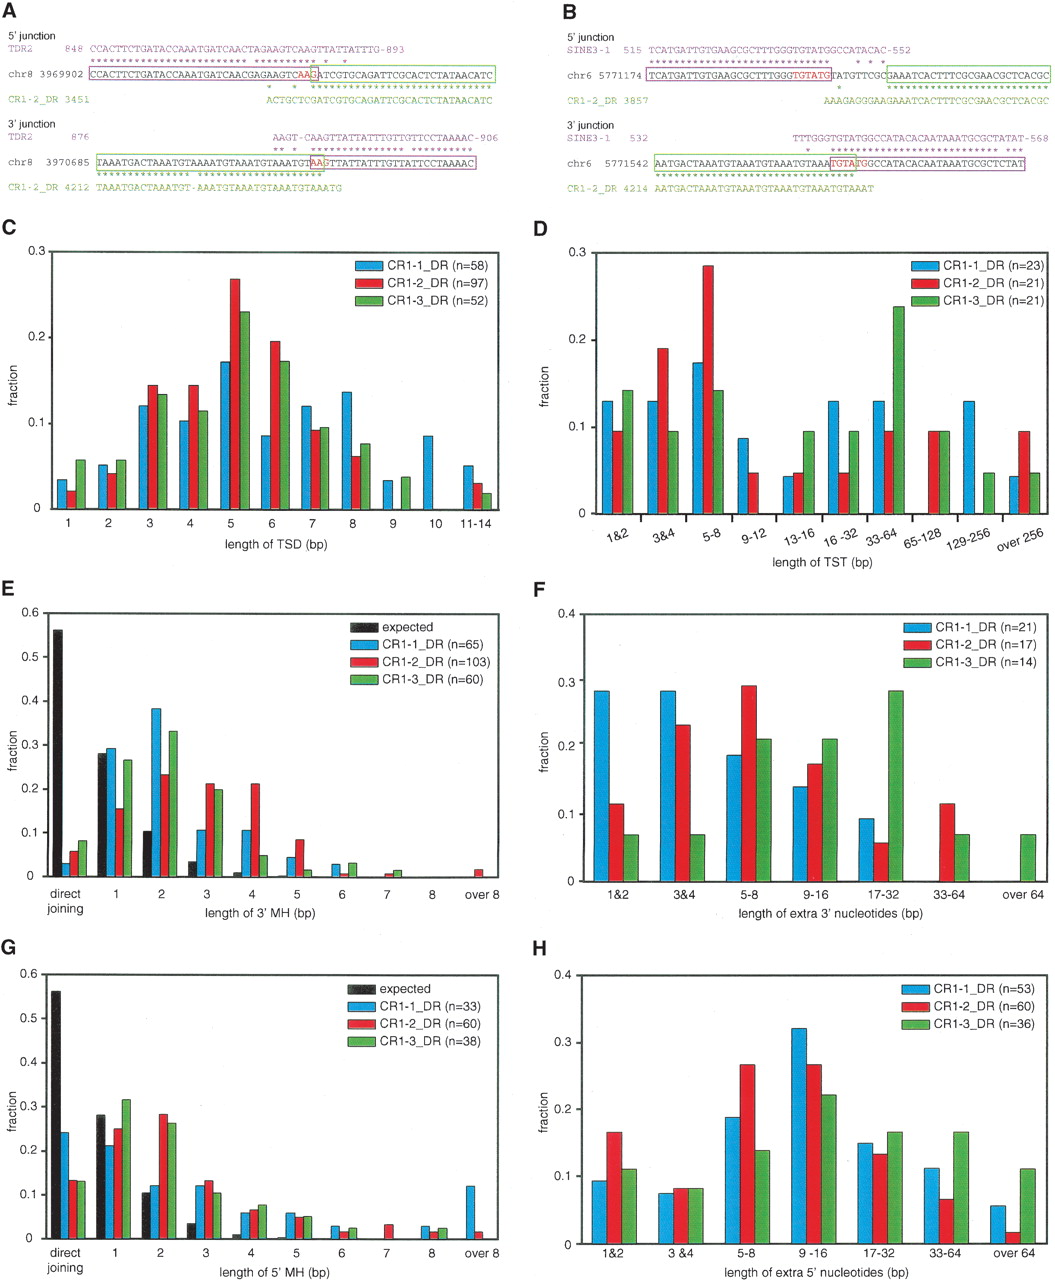
Analysis of integrants of CR1_DRs. (A,B) Two examples of CR1–2_DR integrants. The consensus sequences of the host transposons (magenta, TDR2 in A and SINE3–1 in B), the sequences of parts of the zebrafish genome (black), and the CR1–2_DR consensus sequence (green) are aligned. Asterisks indicate identical sequences, and the magenta and green boxes indicate the regions of CR1–2_DR and host transposons inferred from the alignments. The TSD is shown in red letters. The two integrants have TSDs and 3′ MHs. The example in A has 5′ MH, whereas the example in B has an insertion of extra 5′ nucleotides. (C,D) Length distributions of TSD (C) and TST (D) of CR1_DRs. The colors that discriminate each CR1_DR are indicated in the key in each panel, with the total numbers of CR1_DRs analyzed in parentheses. (E,G) Length distributions of MH at the 3′ (E) and 5′ (G) junctions. The probability distribution of the MH length for two random sequences was calculated as described previously (Roth et al. 1985) and is shown in black. The P values for expected and observed numbers were ≪0.01 in all χ2 tests. (F,H) Length distributions of extra nucleotides at the 3′ (F) and 5′ (H) junctions.


