
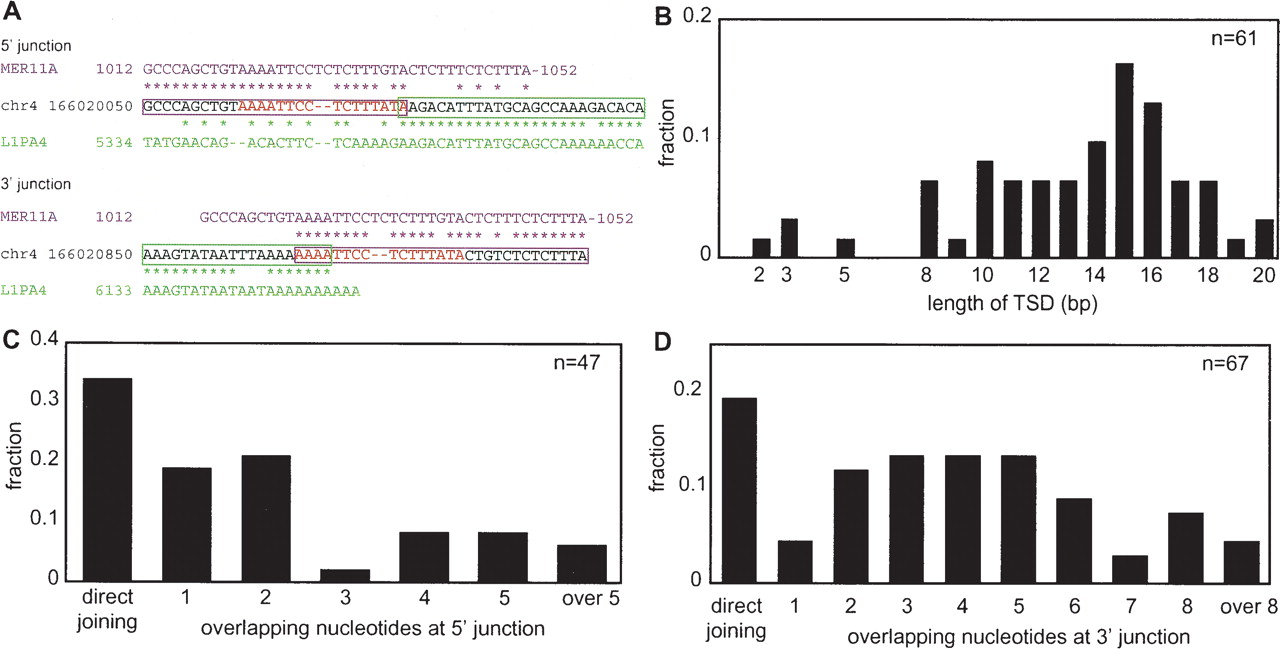
Analysis of L1 integrants within other transposons. (A) An example of a genomic L1 integrant. Only junction regions are shown. The consensus sequence of the host transposon, MER11A (magenta), the sequence of a part of human chromosome 4 (black), and the L1PA4 consensus sequence (green) are aligned. Asterisks indicate identical sequences and the magenta and green boxes indicate MER11A and L1PA4 regions, respectively, inferred from the alignments. The target-site duplication (TSD) is shown in red letters. (B) Length distribution of TSD. Both full-length and 5′-truncated copies are included. (C) Length distribution of the 5′ microhomology (MH). Both full-length and 5′-truncated copies are included. (D) Length distribution of the 3′ MH. Both full-length and 5′-truncated copies are included.


