
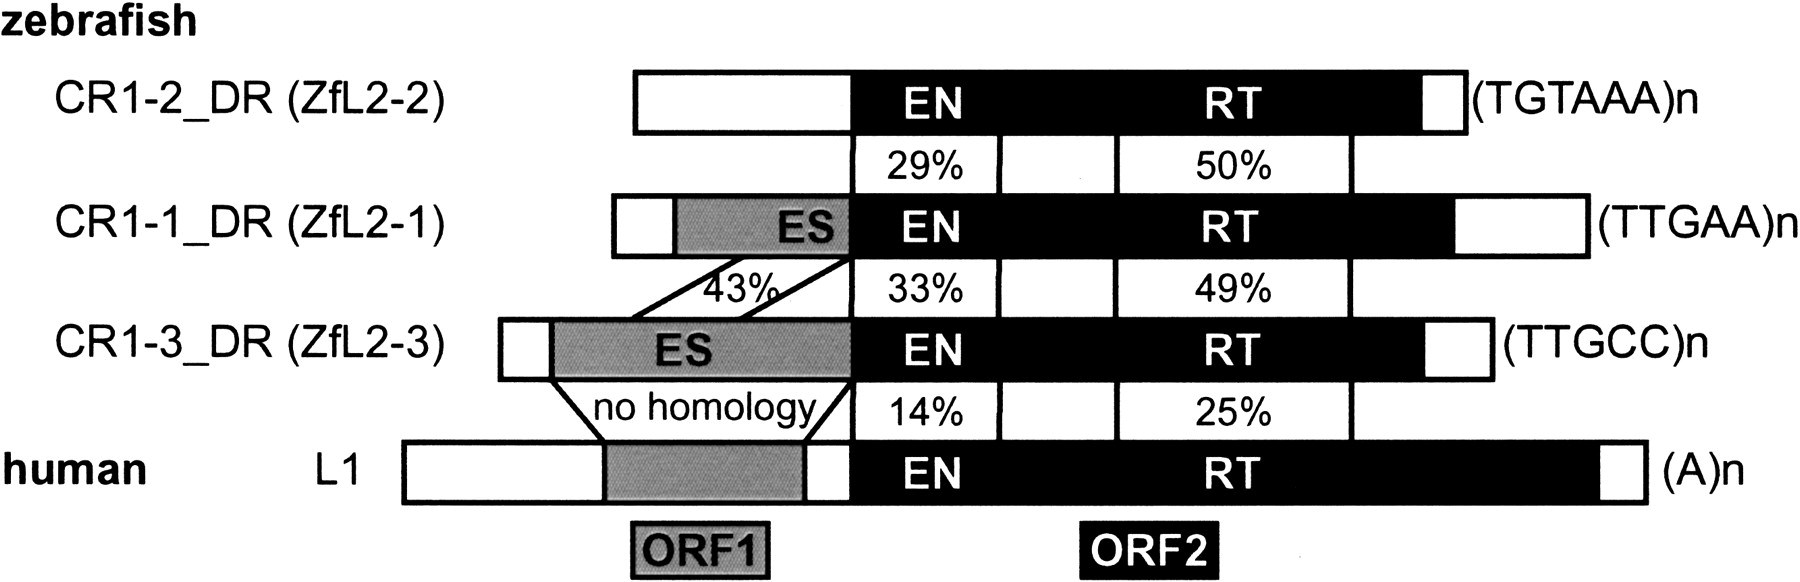
Figure 1.
Schematic representation of the NLRs analyzed in this study. ORF1 and ORF2 are shown in gray and black, respectively. The terminal repeats are shown on the right. The endonuclease, reverse transcriptase, and esterase domains are shown as EN, RT, and ES, respectively. The percentages indicate amino acid identities between any two proteins.


