
Table 3.
Overrepresented GO biological processes
Click on table to view larger version.
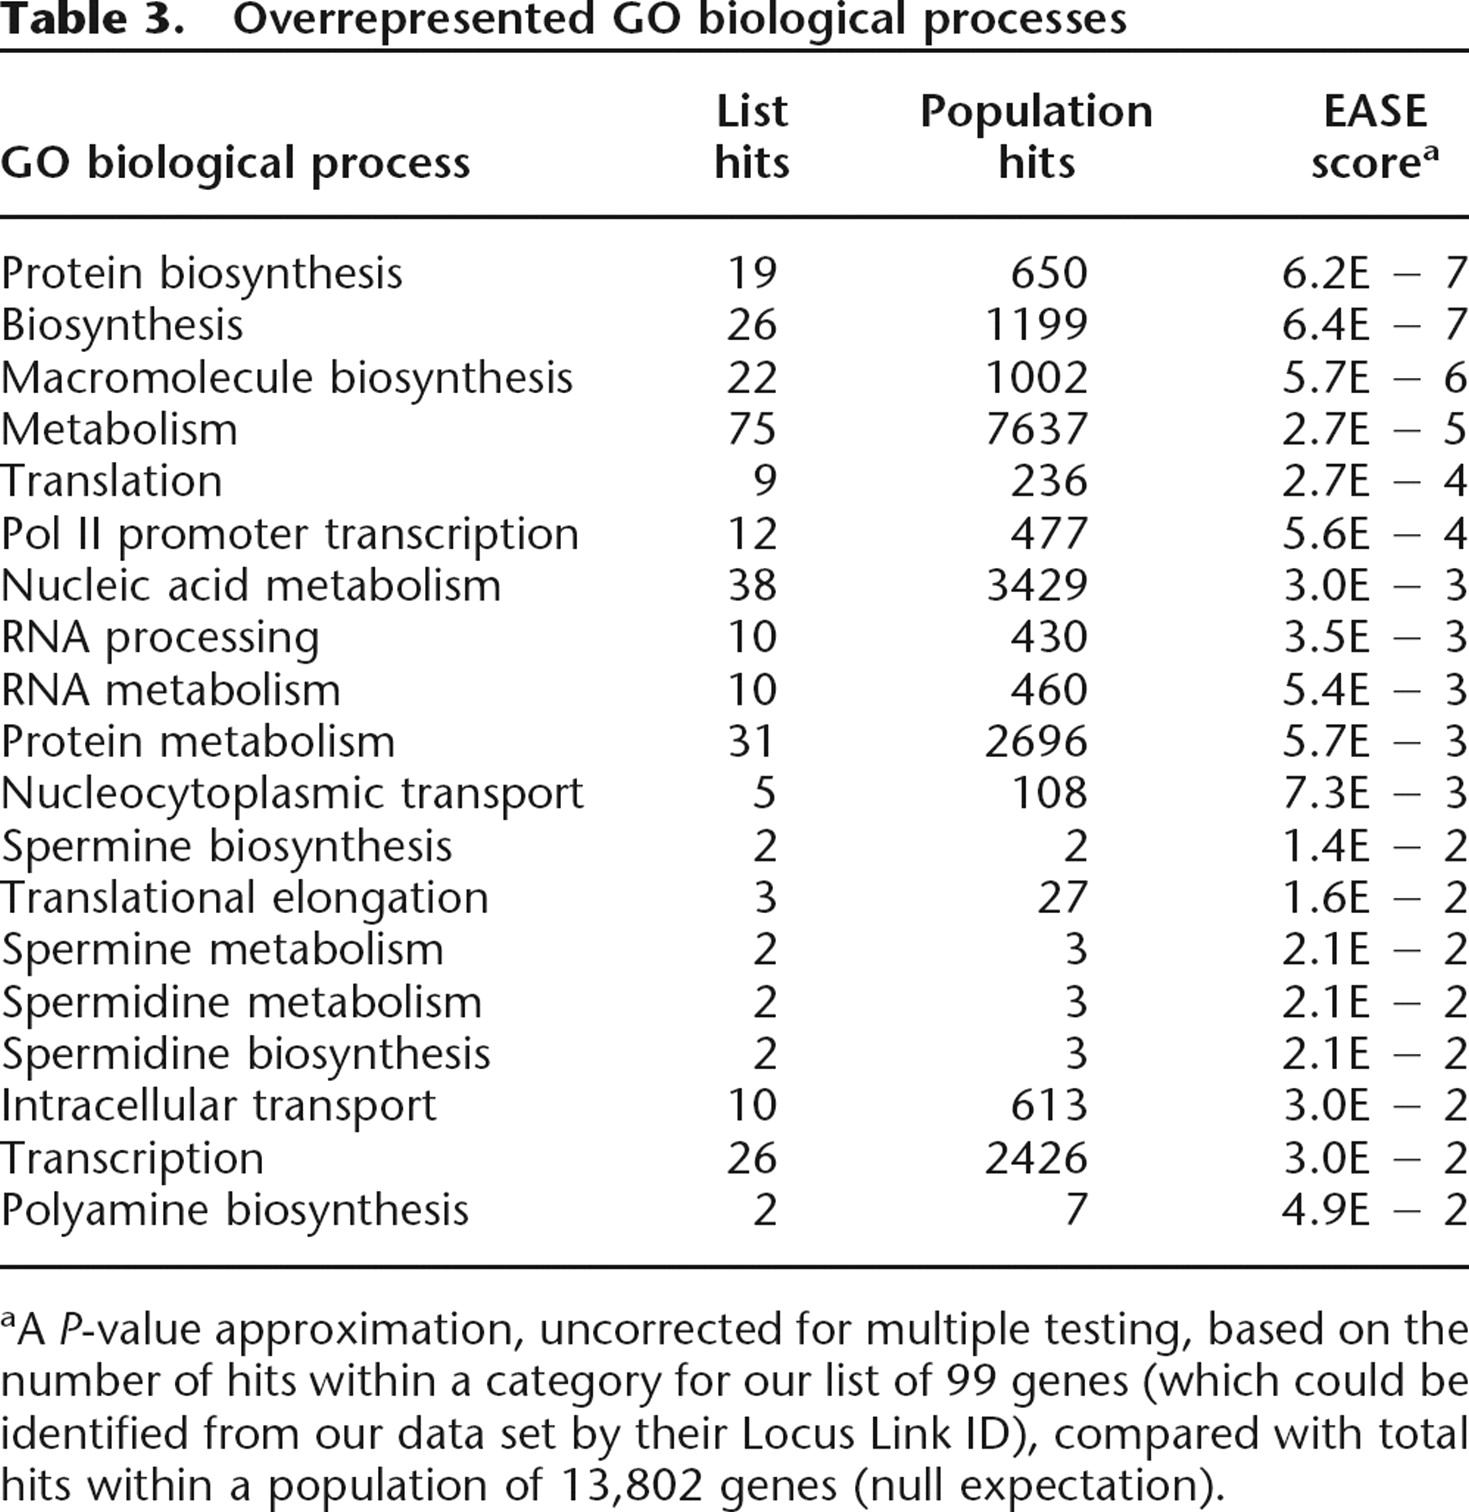
aA P-value approximation, uncorrected for multiple testing, based on the number of hits within a category for our list of 99 genes (which could be identified from our data set by their Locus Link ID), compared with total hits within a population of 13,802 genes (null expectation).


