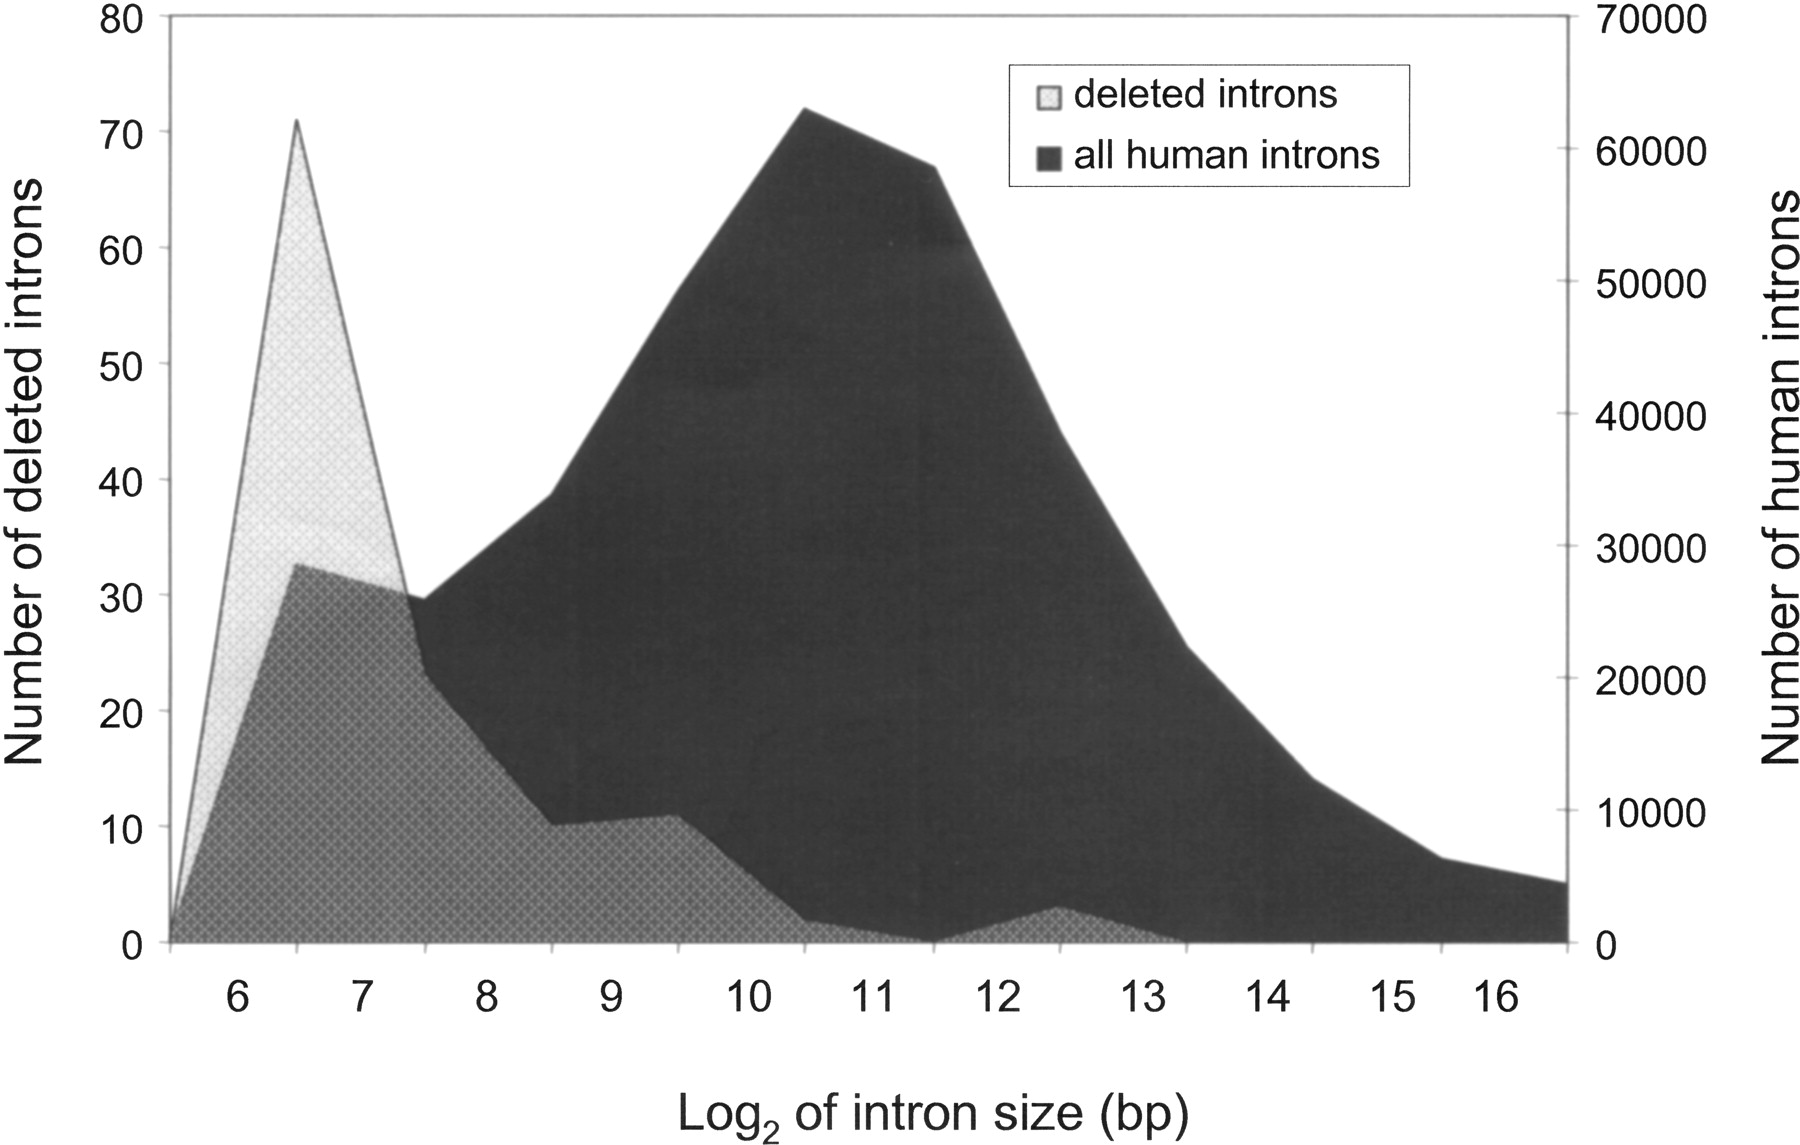
Characterization of intron loss events in mammals

(Downloading may take up to 30 seconds. If the slide opens in your browser, select File -> Save As to save it.)

Click on image to view larger version.

Figure 2.
Figure 2.

Log2(size) distribution of all introns (black) versus deleted introns (gray). The deleted introns are unusually short and much shorter than the human genome average.

This Article

  1. Genome Res. 17: 23-32

Preprint Server