
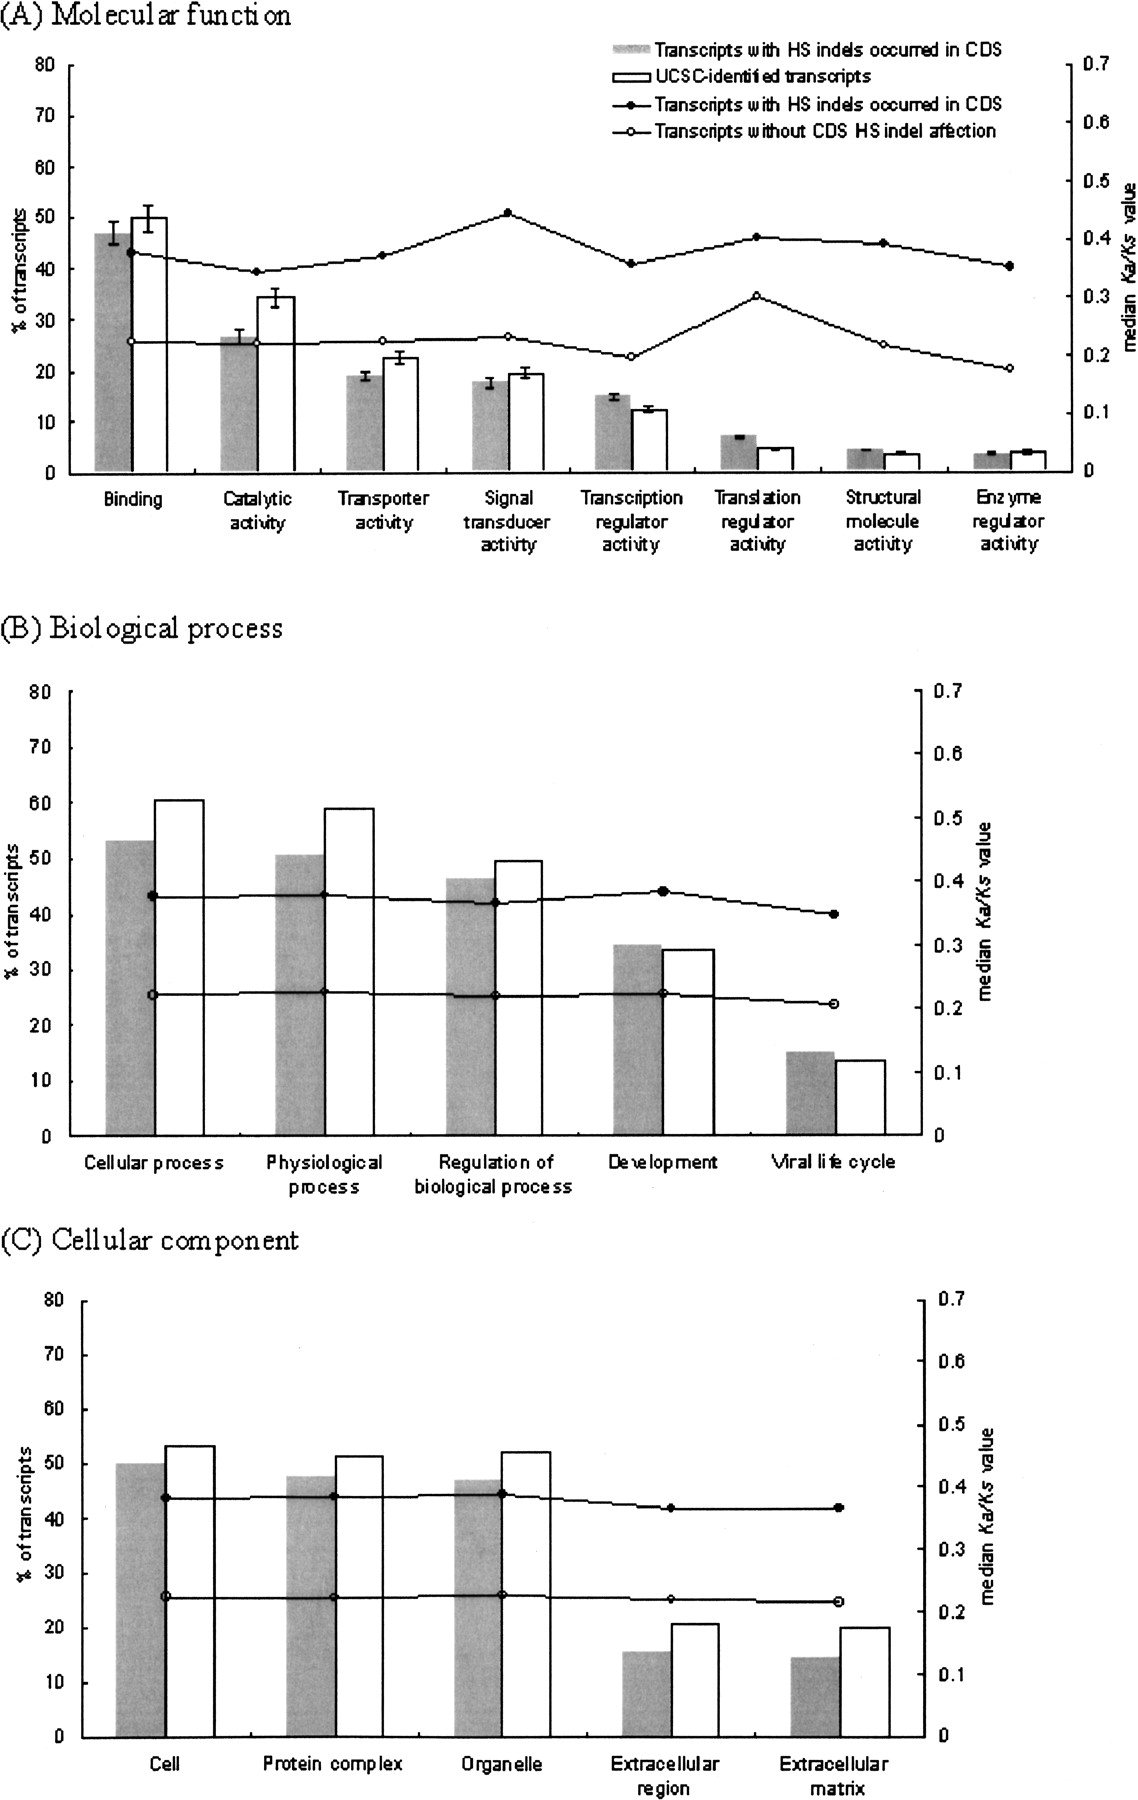
Figure 4.
Gene ontology analysis of transcripts in which coding exons were affected by human-specific (HS) indels. The error bars indicate 95% confidence interval. The curves display comparisons of median Ka/Ks values for transcripts affected by CDS-HS indel(s) and transcripts without CDS-HS indel for each GO subcategory.


