
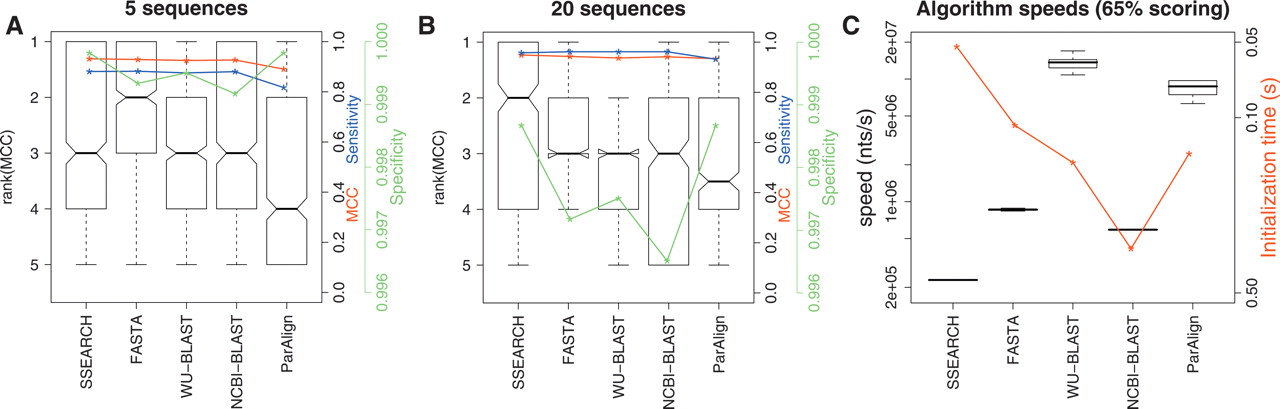
A comparison of the accuracy of sequence-based methods with the 65% scoring scheme and identical scoring parameters. These boxplots show the distributions of the ranks on MCC and timing data for each of the homology search methods when using a scoring scheme optimized for nucleotide sequences with 65% identity (match = +5, mismatch = −4, gapopen = 10, gapextension = 10). (A,B) Boxplots of algorithm ranks for the 5 and 20 sequence subsets, respectively. The blue curves show the median sensitivity, the green curve the median specificity, and the red curve the median MCC for each of the 12 programs. (C) Boxplots of algorithm speeds in nucleotides per second. The red curve shows median initialization times for the different programs.


