
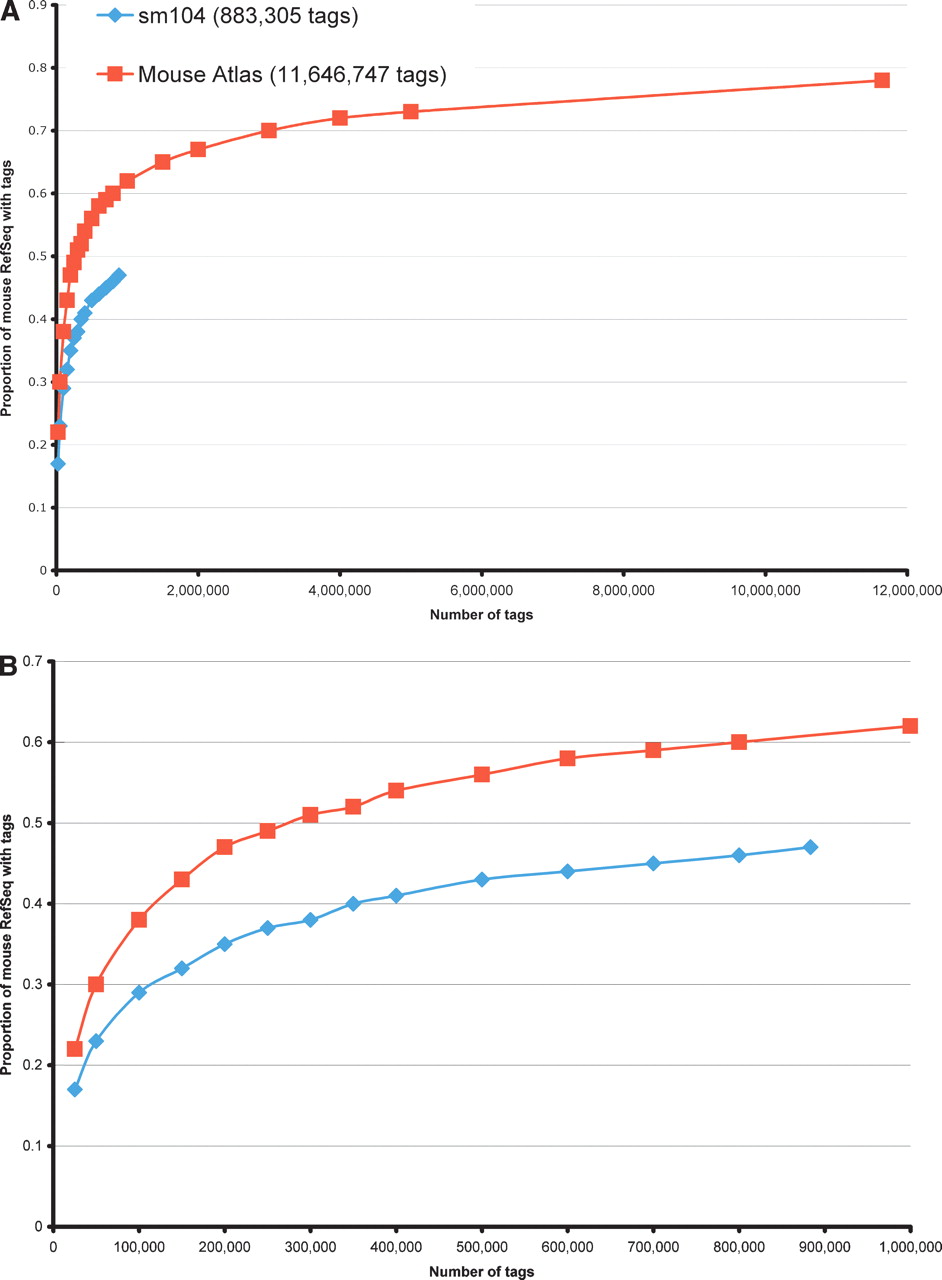
Coverage of the mouse Reference Sequence (RefSeq) data set. The proportion of entries in the mouse RefSeq database represented by a LongSAGE tag in a deeply sampled LongSAGE library (sm104 kidney, >800,000 tags; blue diamonds) and in a meta-library of Mouse Atlas tags (>11,000,000 tags; red squares) is shown. Plotted on the y-axis is the proportion of RefSeq covered. The number of tags is plotted on the x-axis. (A) With sequential sampling, performed computationally, both data sets exhibit rapid coverage of a subset of RefSeq as tag count increases. As expected, the meta-library exhibits superior coverage. (B) The same data, but with an expanded scale along the x-axis to better display the kidney library data.


