
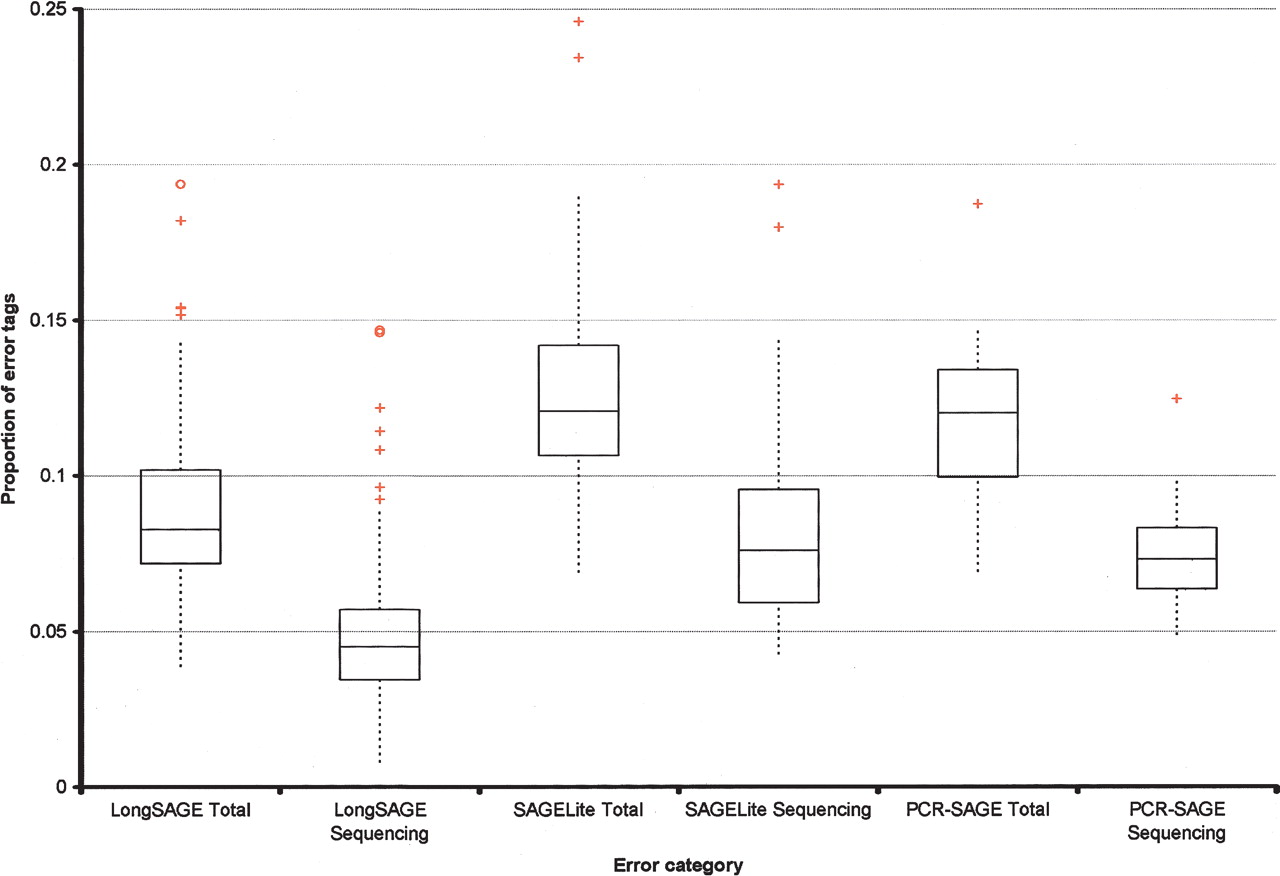
Box-and-whisker plots indicating the proportion of error tags observed in libraries constructed using LongSAGE, SAGELite, and PCR-SAGE. Error categories, on the x-axis, refer to the error attributed only to sequencing (for example, “LongSAGE Sequencing”) or to all contributing sources of error, including sequencing (for example, “LongSAGE Total”). Boxes encompass the lower and upper quartiles. (Horizontal line drawn through each box) Median error value for each category, (red crosses and circles) possible outliers. Comparing the three “Total” categories to one another and the three “Sequencing” categories to one another indicates that LongSAGE data exhibit lower proportions of error tags than the other methods. PCR-SAGE and SAGE-Lite were the methods of choice when RNA quantities were limiting. Both approaches involve additional amplification steps, compared with the LongSAGE method. It is possible that this additional amplification contributes to the observed increased proportion of error tags in these libraries.


