
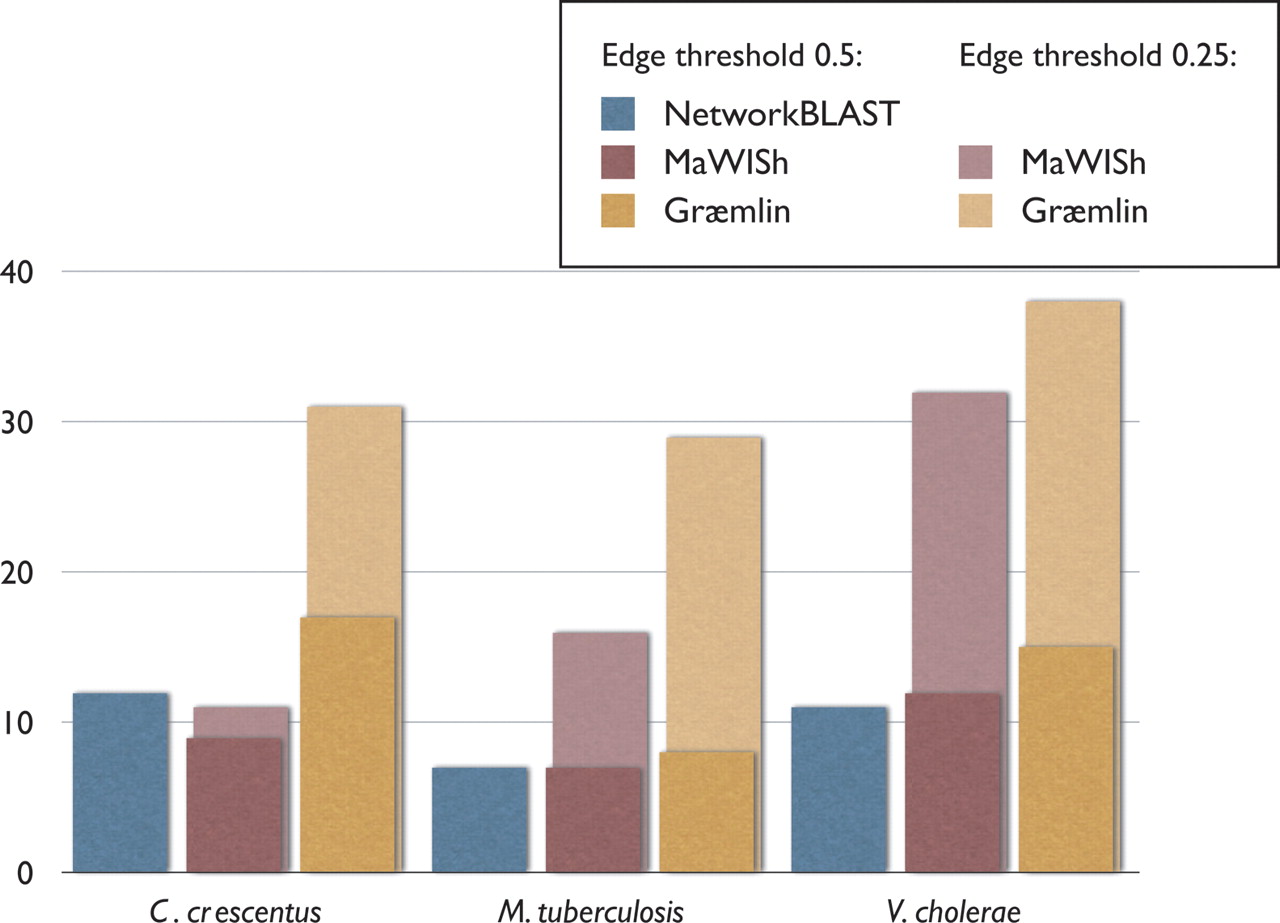
Figure 4.
Sensitivity comparison of methods. For three pairwise alignments of E. coli, shown are the number of KEGGs hit by each aligner. For Græmlin and MaWISh, this graph includes results on networks with edge thresholds of both hold and 0.5. For NetworkBLAST, however, we only include results on networks thresholded at 0.5, as it did not scale to denser inputs.


