
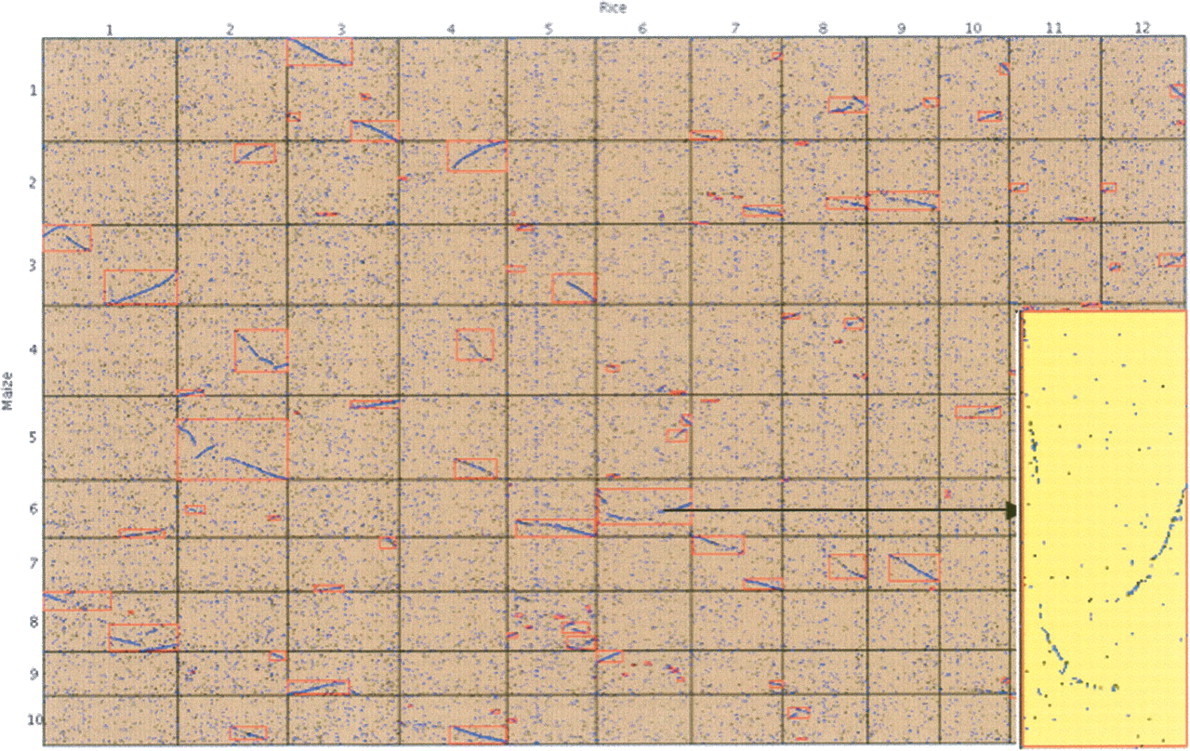
Figure 5.
A maize FPC (19.7.2005 release) to rice genomic sequence (IRGSP V4) dot plot. The dot plot by default is drawn to fit the browser; therefore, the maize coordinates are compressed. There is an option to show the dot plot to scale; the scaled dot plot for maize chromosome 6 and rice chromosome 6 is shown in the lower right corner (covering the dot plots for maize 5–10 and rice 11–12).


