
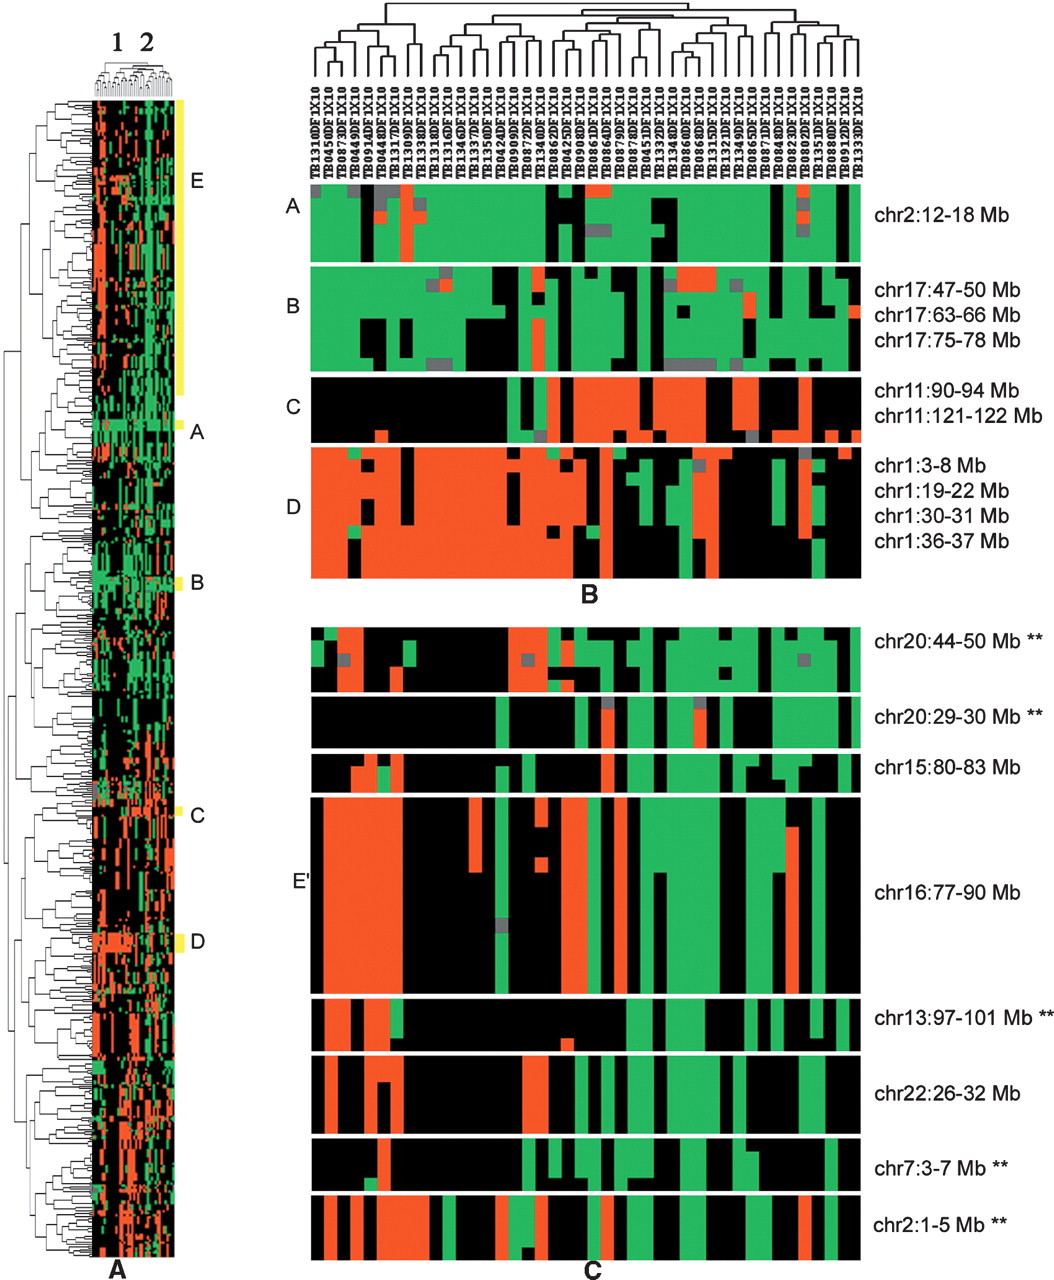
Figure 5.
Unsupervised two-way hierarchical clustering of 42 neuroblastoma (NB) cell lines based on significant STAC regions of gain and loss. (A) Two main sample clusters. (B) Known clinically and/or biologically relevant regions. (C) Additional regions characterizing two sample clusters. Labels A–E represent locations present in zoomed image. A and B represent known gains in NB. C and D represent known losses in NB that are negatively correlated. E′ indicates that only a subset of locations from E are displayed. **Significant by STAC analysis, but not reported in Mosse et al. (2005).


