
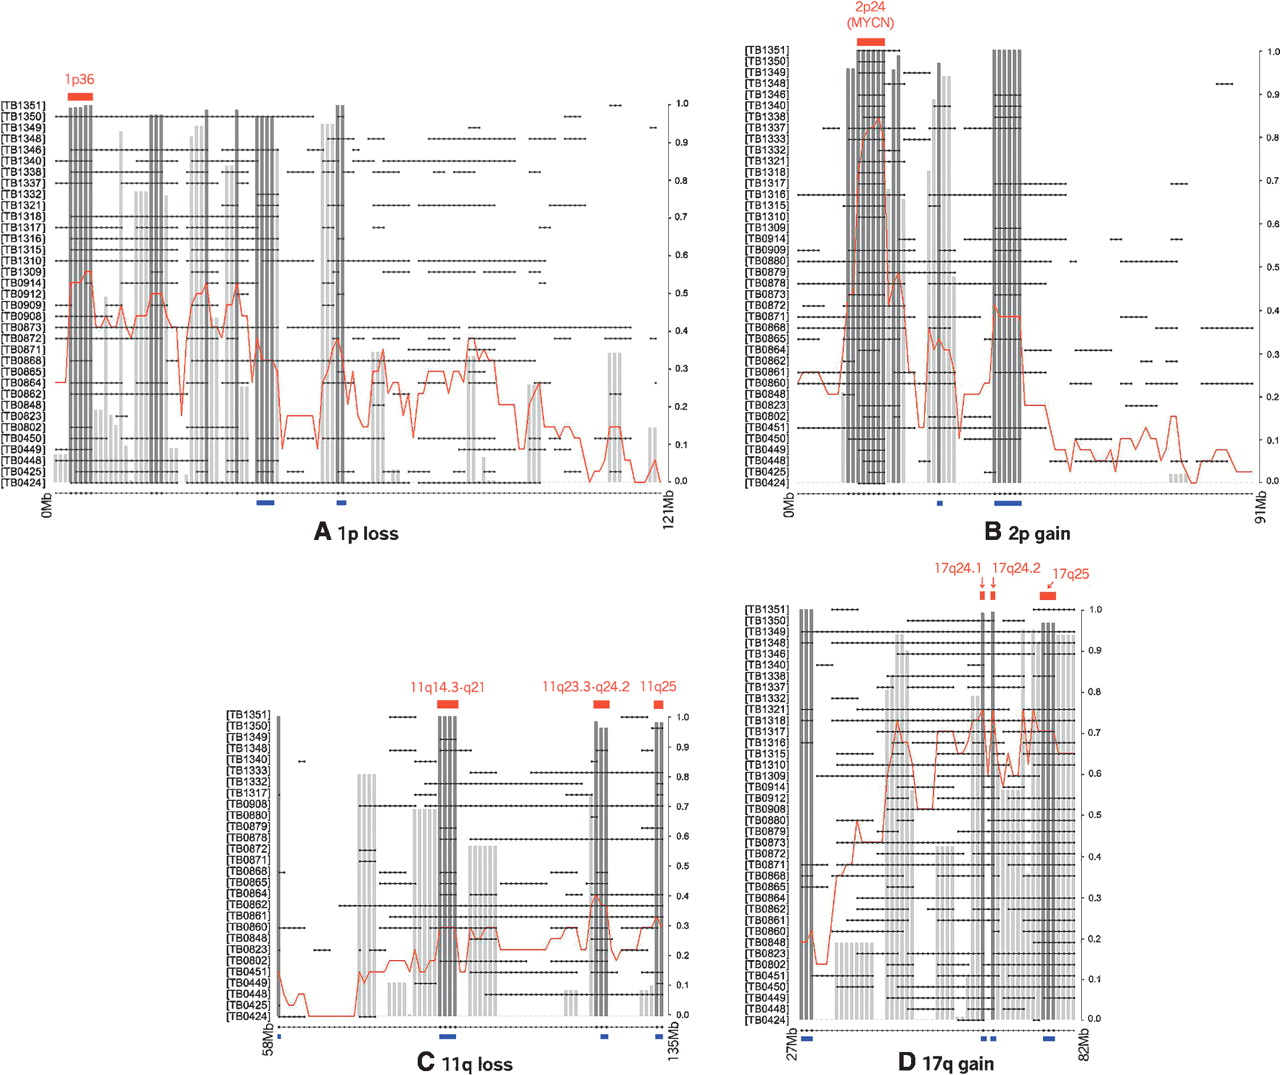
Figure 4.
STAC identifies clinically and biologically relevant regions in neuroblastoma. For each arm studied, 1-Mb locations are plotted along the x-axis, and each sample having at least one interval of aberration along the chromosome arm is plotted on the y-axis. The gray bars track the maximum STAC confidence (1 − P-value), darker bars are those with confidence >0.95. Locations indicated at the top by a red bar designate significant stacks falling within (or spanning) regions of known biological and/or clinical relevance. Locations indicated at the bottom by a blue bar were found significant only by the footprint. (A) 1p loss; (B) 2p gain; (C) 11q loss; (D) 17q gain.


