
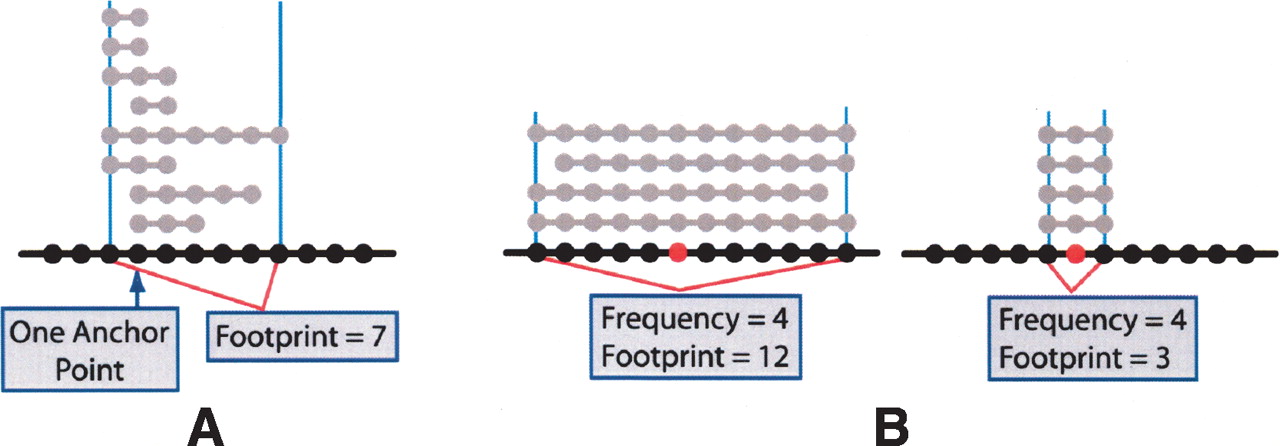
Footprint of a stack. (A) The footprint of a stack is the number of locations contained in some interval of the stack. The anchor point(s) of a stack are the locations contained in every interval of the stack. Black dotted line represents a stretch of genome. Gray dotted lines represent aberrant intervals. (B) Footprint accounts for interval lengths. Two example stacks are shown; “frequency” and “footprint” indicate values of frequency and footprint, respectively. Both stacks cover the location indicated in red; however, the stack on the right provides greater evidence for localization of an important gene at this location; this is reflected in its smaller footprint.


