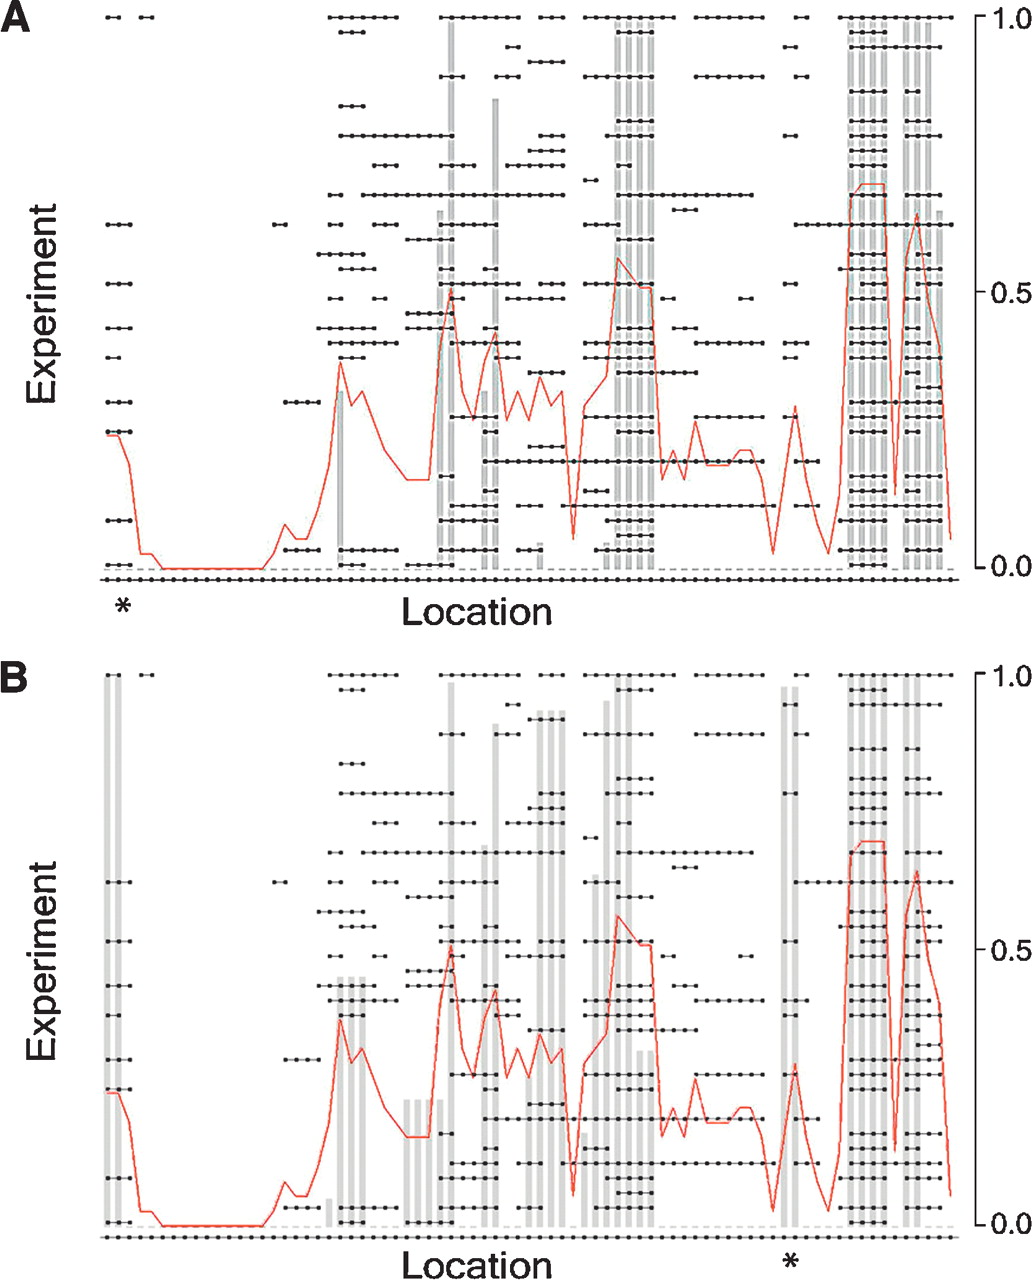
STAC: A method for testing the significance of DNA copy number aberrations across multiple array-CGH experiments

(Downloading may take up to 30 seconds. If the slide opens in your browser, select File -> Save As to save it.)

Click on image to view larger version.

Figure 2.
Figure 2.

Results for example data using frequency and footprint statistics. Display showing data from Figure 1 with overlay of the confidences, indicated by gray bars. The red line graphs the actual frequencies in the sample set. (A) Frequency only. (B) Footprint only.

This Article

  1. Genome Res. 16: 1149-1158

Preprint Server