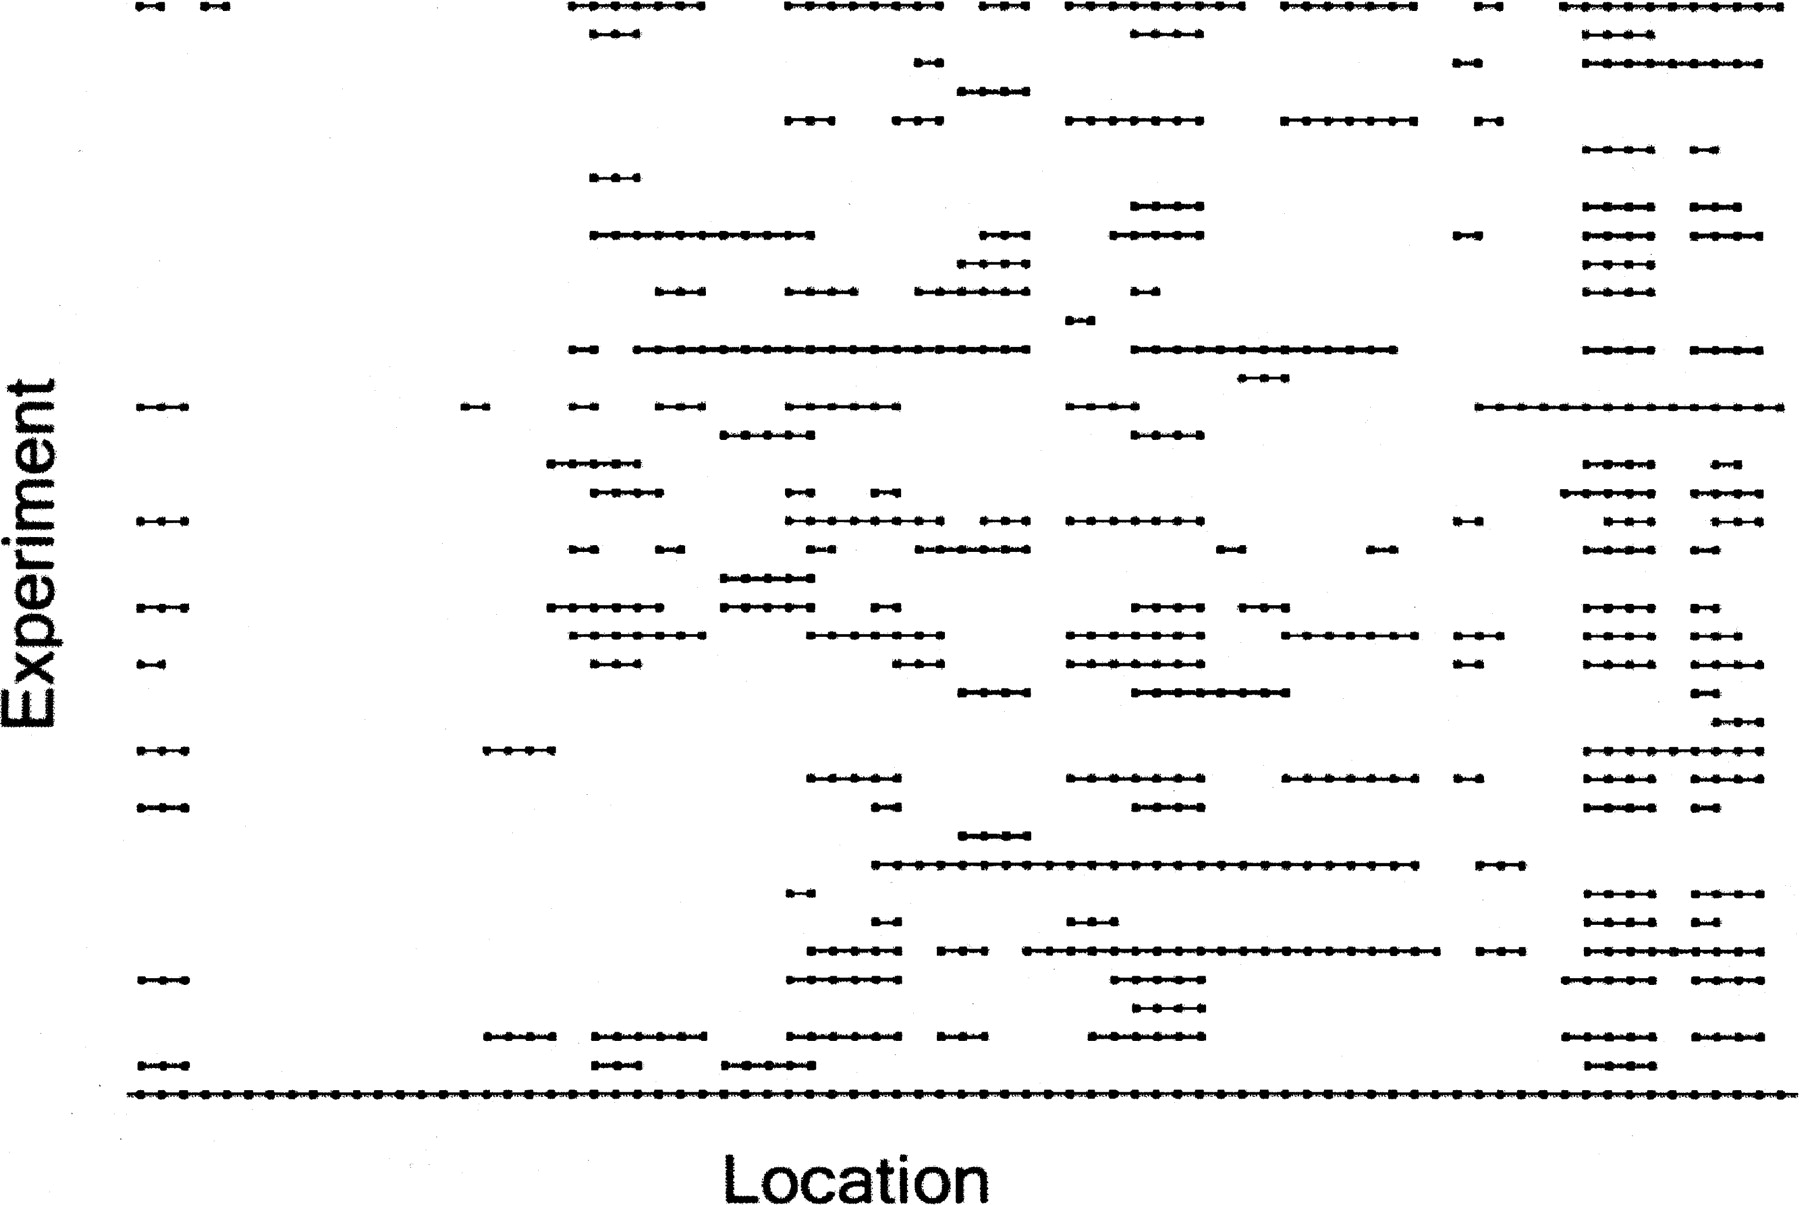
STAC: A method for testing the significance of DNA copy number aberrations across multiple array-CGH experiments

(Downloading may take up to 30 seconds. If the slide opens in your browser, select File -> Save As to save it.)

Click on image to view larger version.

Figure 1.
Figure 1.

Example of chromosome 11 loss data from a set of breast cancers. Rows represent samples, and columns represent chromosomal locations. A black dot indicates there was a loss call made for that sample at that location. Consecutive black dots are connected by a line to represent an interval of aberration.

This Article

  1. Genome Res. 16: 1149-1158

Preprint Server