
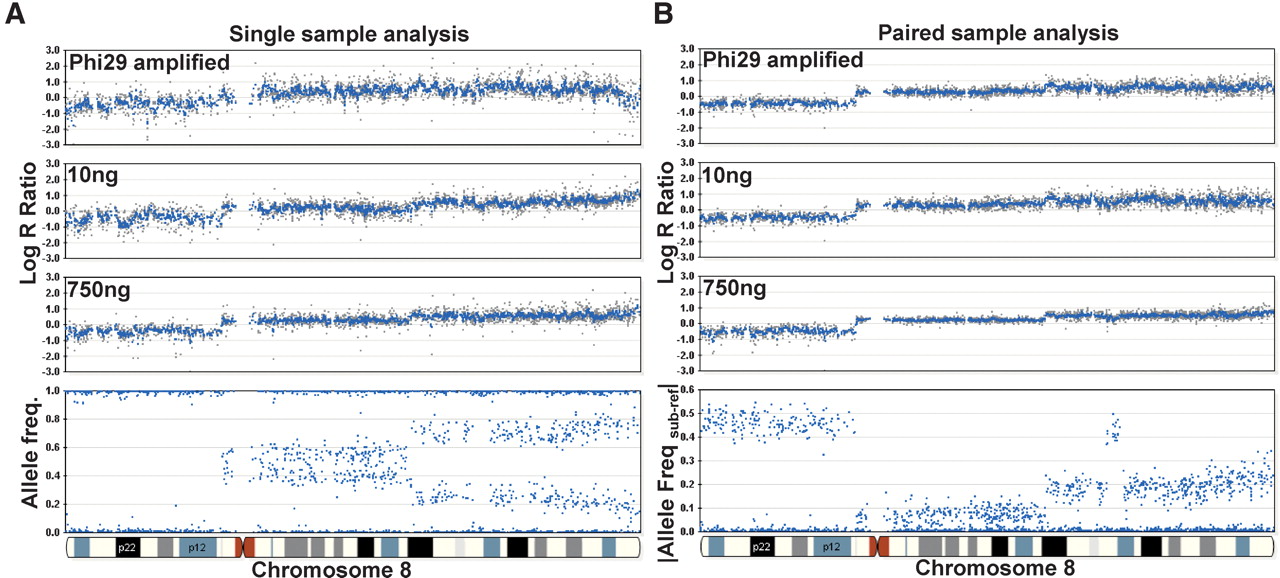
Paired versus single sample analysis. Varying starting inputs of DNA (10 ng and 750 ng) from a paired breast tumor cell line were hybridized to a multisample BeadChip containing a subset of loci (∼33,000) from the HumanHap300 product. In addition, Phi29 was used to amplify 10 ng of gDNA, and 750 ng of this amplified product was used in the initial whole-genome amplification step. Overall, we find that the effect of different inputs of gDNA on the resulting genomic profiles is ameliorated by paired-sample analysis. (A) In the single sample mode, the variability (standard deviation) in the log R ratio is shown as gray dots for Phi29-amplified gDNA, 10 ng of input DNA, and 750 ng of input gDNA (from top to bottom). (B) In the paired-sample mode, the variation in the log R ratio across chromosome 8 is reduced for the same samples. For reference, the AF for the tumor sample is shown on the bottom left and the |Allele Freq subject-reference| for the same tumor sample with paired analysis is shown on the bottom right. Using paired-sample analysis, the allele frequency difference between normal and tumor genotypes is very distinct. Where applicable, a 500-kb moving median was used (blue line).


