
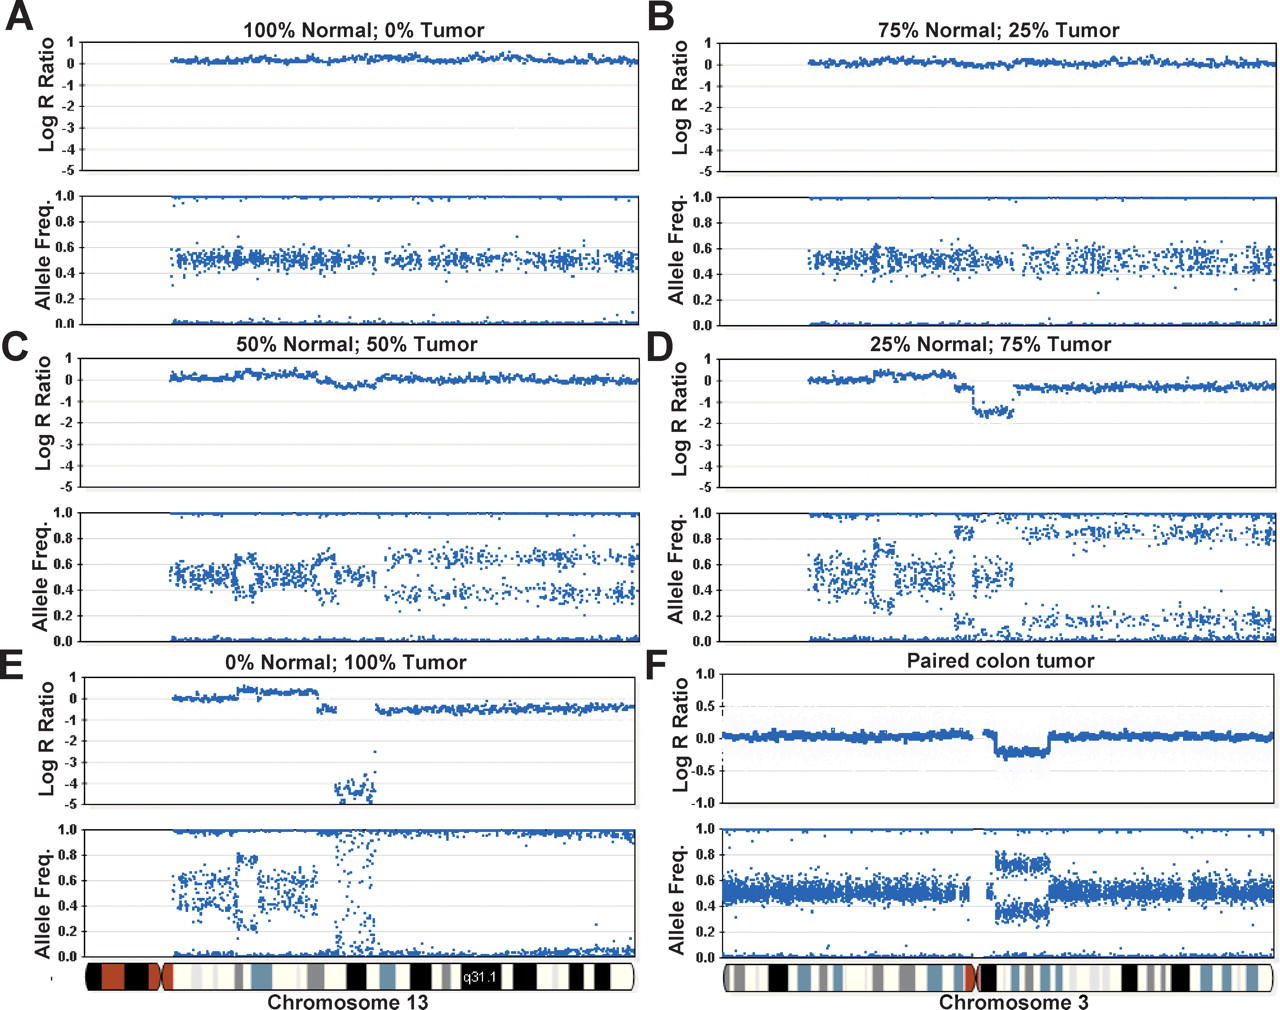
Analyzing heterogeneous tumor samples. DNA from a tumor cell line was mixed with matched normal DNA at ratios of 0%, 25%, 50%, 75%, and 100% and analyzed on the Human-1 (109K) BeadChip. The genome profile of chromosome 13 is shown as an example. (A) No aberrations are seen in the sample containing 100% normal gDNA. (B) No discernable differences in the log R ratio are seen in a sample composed of 75% normal and 25% tumor. It is also difficult to determine if there are any changes in the allelic frequency. (C) At 50% normal and 50% tumor DNA, deflections in the log R ratio appear. Changes in the AF are also seen, although it is difficult to establish the nature of each aberration. At these levels, an allelic duplication event and allelic LOH bear resemblance to each other. (D) At 25% normal and 75% tumor gDNA, the nature of each type of aberration becomes more apparent. For example, the large decrease in the log R ratio in the center of the plot denotes a potential region with a deletion, which was not easily discernable in C. (E) The genoplot from a pure (100%) tumor sample. A homozygous deletion can be seen in the center of the plot, visualized by a decrease in the log R ratio. (F) A region exhibiting LOH is observed on chromosome 3 in a paired colon tumor patient sample analyzed on the HumanHap300 BeadChip. A decrease in the log R ratio indicates a loss of copy number. The AF is divided into two populations(∼0.33 and ∼0.67), suggesting that this sample contains ∼67% normal cells. The blue line shown for all log R ratio profiles indicates a 250-kb and a 100-kb moving median for the Human-1 and HumanHap300 BeadChips, respectively.


