
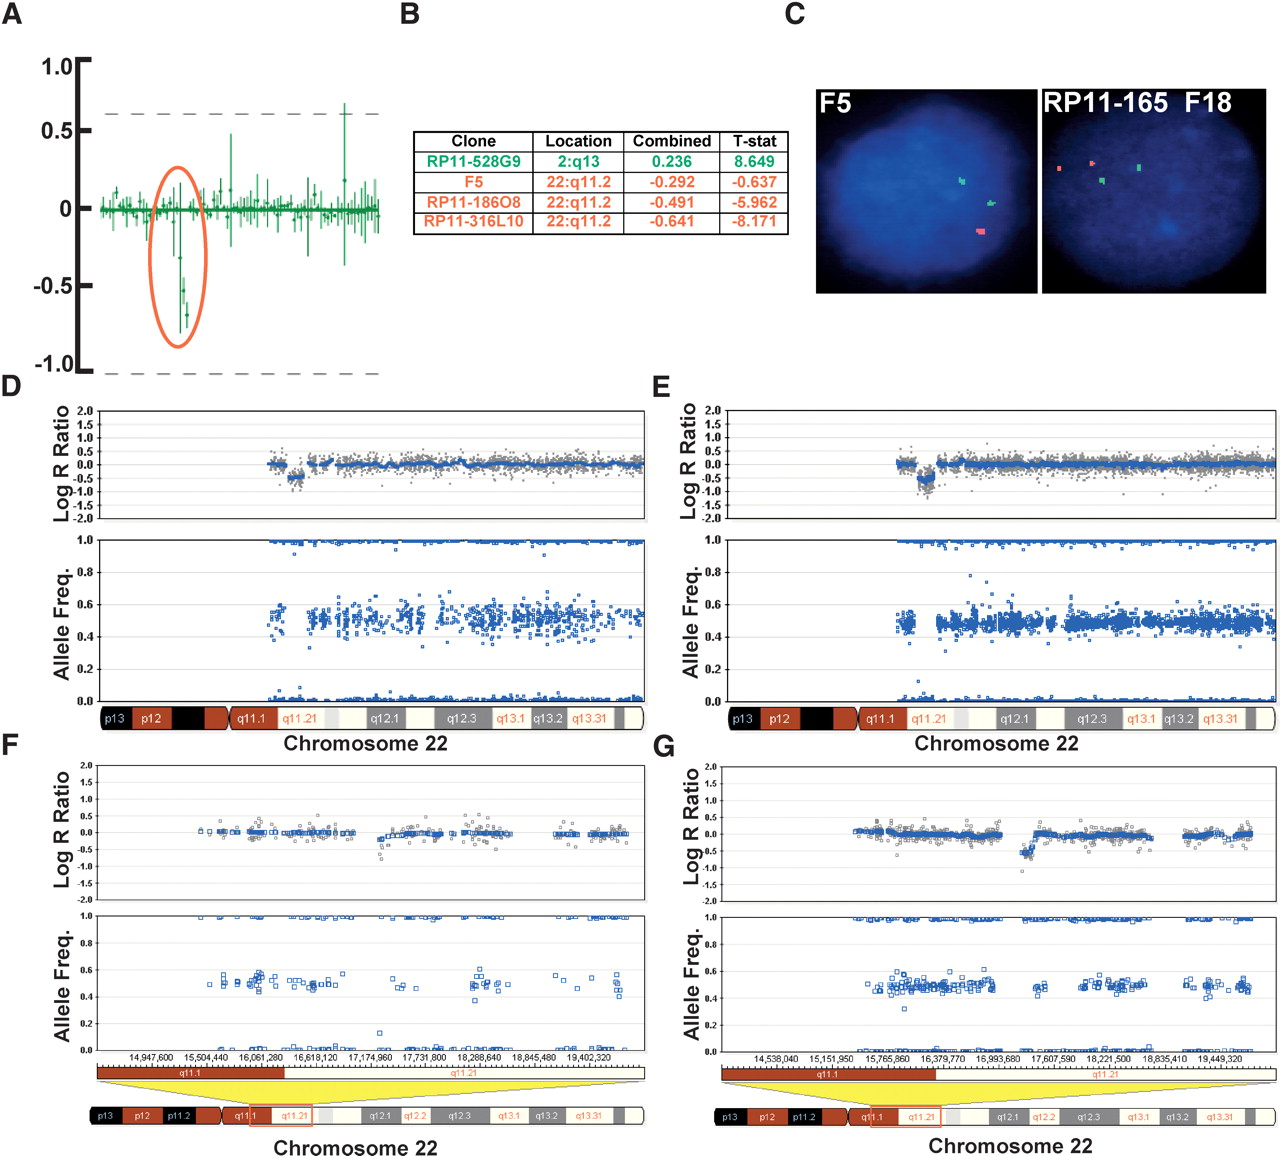
Verification of a chromosomal deletion with BAC array-CGH and FISH. We performed a blinded study on samples collected from patients with developmental clinical phenotypes previously characterized by karyotype, FISH, and BAC array-CGH analysis. (A) Data from a chromosomal BAC microarray showing the mean values of signal to noise (T/R) ratio and error bars of data from two separate hybridizations. The profile shown here represents an enlarged section of a chromosomal microarray showing a loss of three clones in the DiGeorge syndrome I critical region (encircled in red). (B) List of BAC clones, their location, and the log2 R ratio, indicating a loss of copy number in this region (three clones denoted in red). One additional clone shows a potential amplification present in another position in the genome (denoted in green; plots not shown). (C) FISH analysis using the F5 clone (for the DiGeorge region) showing one signal in red while the control probe in green shows two signals, confirming a deletion in the DiGeorge critical region. FISH analysis using the RP11-165F18 clone (distal to F5) shows no deletion. (D) The same aberration, an ∼1.5-Mb deletion on chromosome 22q11.2, detected by SNP-CGH on the Human-1 (109K) array as seen by the deflection in the log R ratio and the loss of heterozygote data points in the AF. (E) The same deletion on chromosome 22q11.2 detected by SNP-CGH on the HumanHap300 (317K) array. Notice the higher density of SNPs in this region on the HumanHap300 BeadChip. This finding confirms the deletion known to be present in the critical region of the DiGeorge syndrome. (F) Another deletion detected on chromosome 22q11.21 that is difficult to discern with the Human-1, which was not detected with any other method. (G) The same deletion can clearly be visualized with the HumanHap300 BeadChip, especially by the deflection in the log R ratio. For all plots, the blue line indicates a 500-kb and a 100-kb moving median, for the Human-1 and HumanHap300 BeadChips, respectively.


