
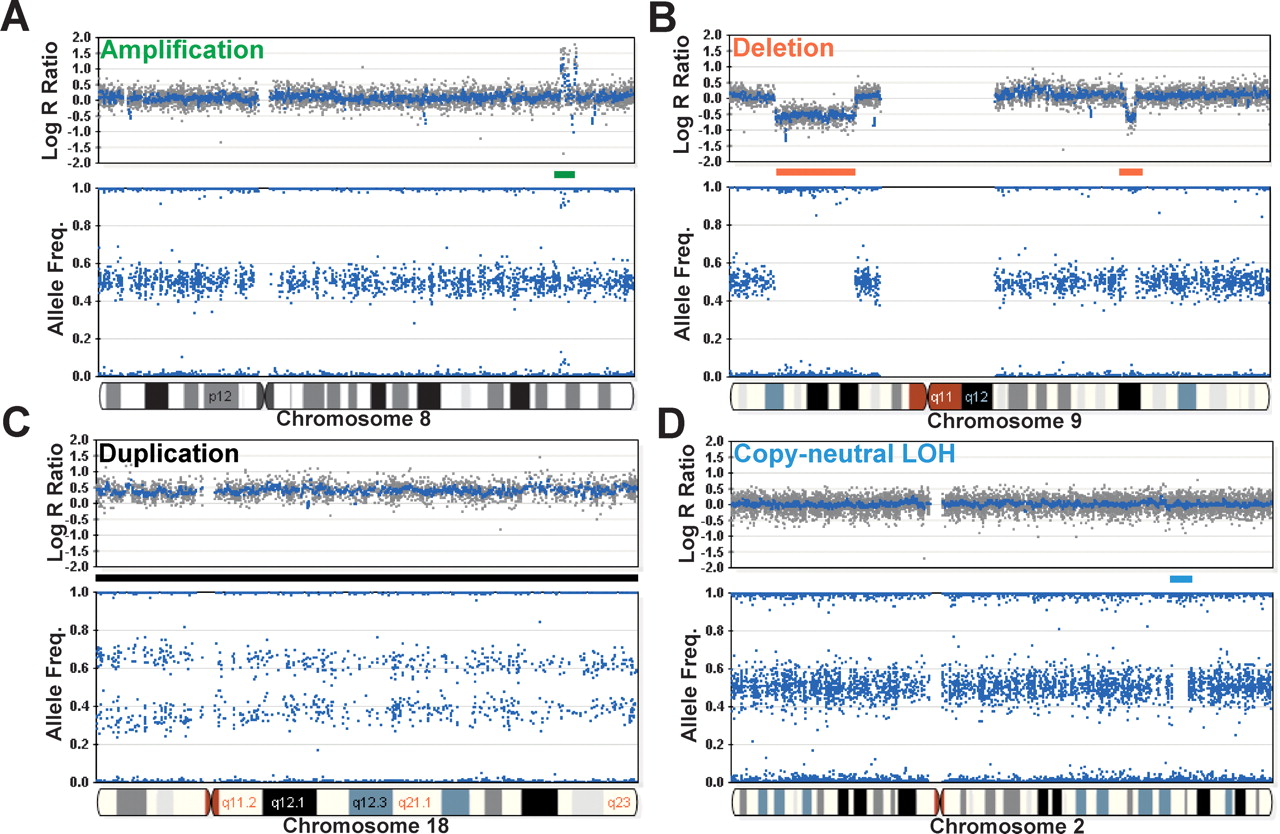
Examples of aberrations using HL-60 on the 109K BeadChip. The human promyelocytic leukemia cell line (HL-60) contains several well-characterized chromosomal aberrations. (A) An example of several discrete monoallelic amplifications across an ∼4.5-Mb region on chromosome 8 (green bar). The monoallelic amplification is evidenced by an increase in the log R ratio and the large split in the allele frequency. Based on the allelic ratios of ∼0.1 and ∼0.9, the level of amplification is on the order of five-to 10-fold. (B) Two deletions found on chromosome 9 (red bars). The first, which is ∼21 Mb, is detected by a deflection in the log R ratio and the collapse of heterozygotes in the allele frequency. The second deletion (∼2.4 Mb) was also detected using the same parameters. (C) The entire length of chromosome 18 (∼76 Mb) is duplicated (black bar), inferring a total copy number of 3. Notice the increase of the log R ratio to ∼0.5 and the cluster split in AF. (D) SNP-CGH arrays can detect a copy-neutral LOH event such as recombination or gene conversion. A small region on chromosome


