
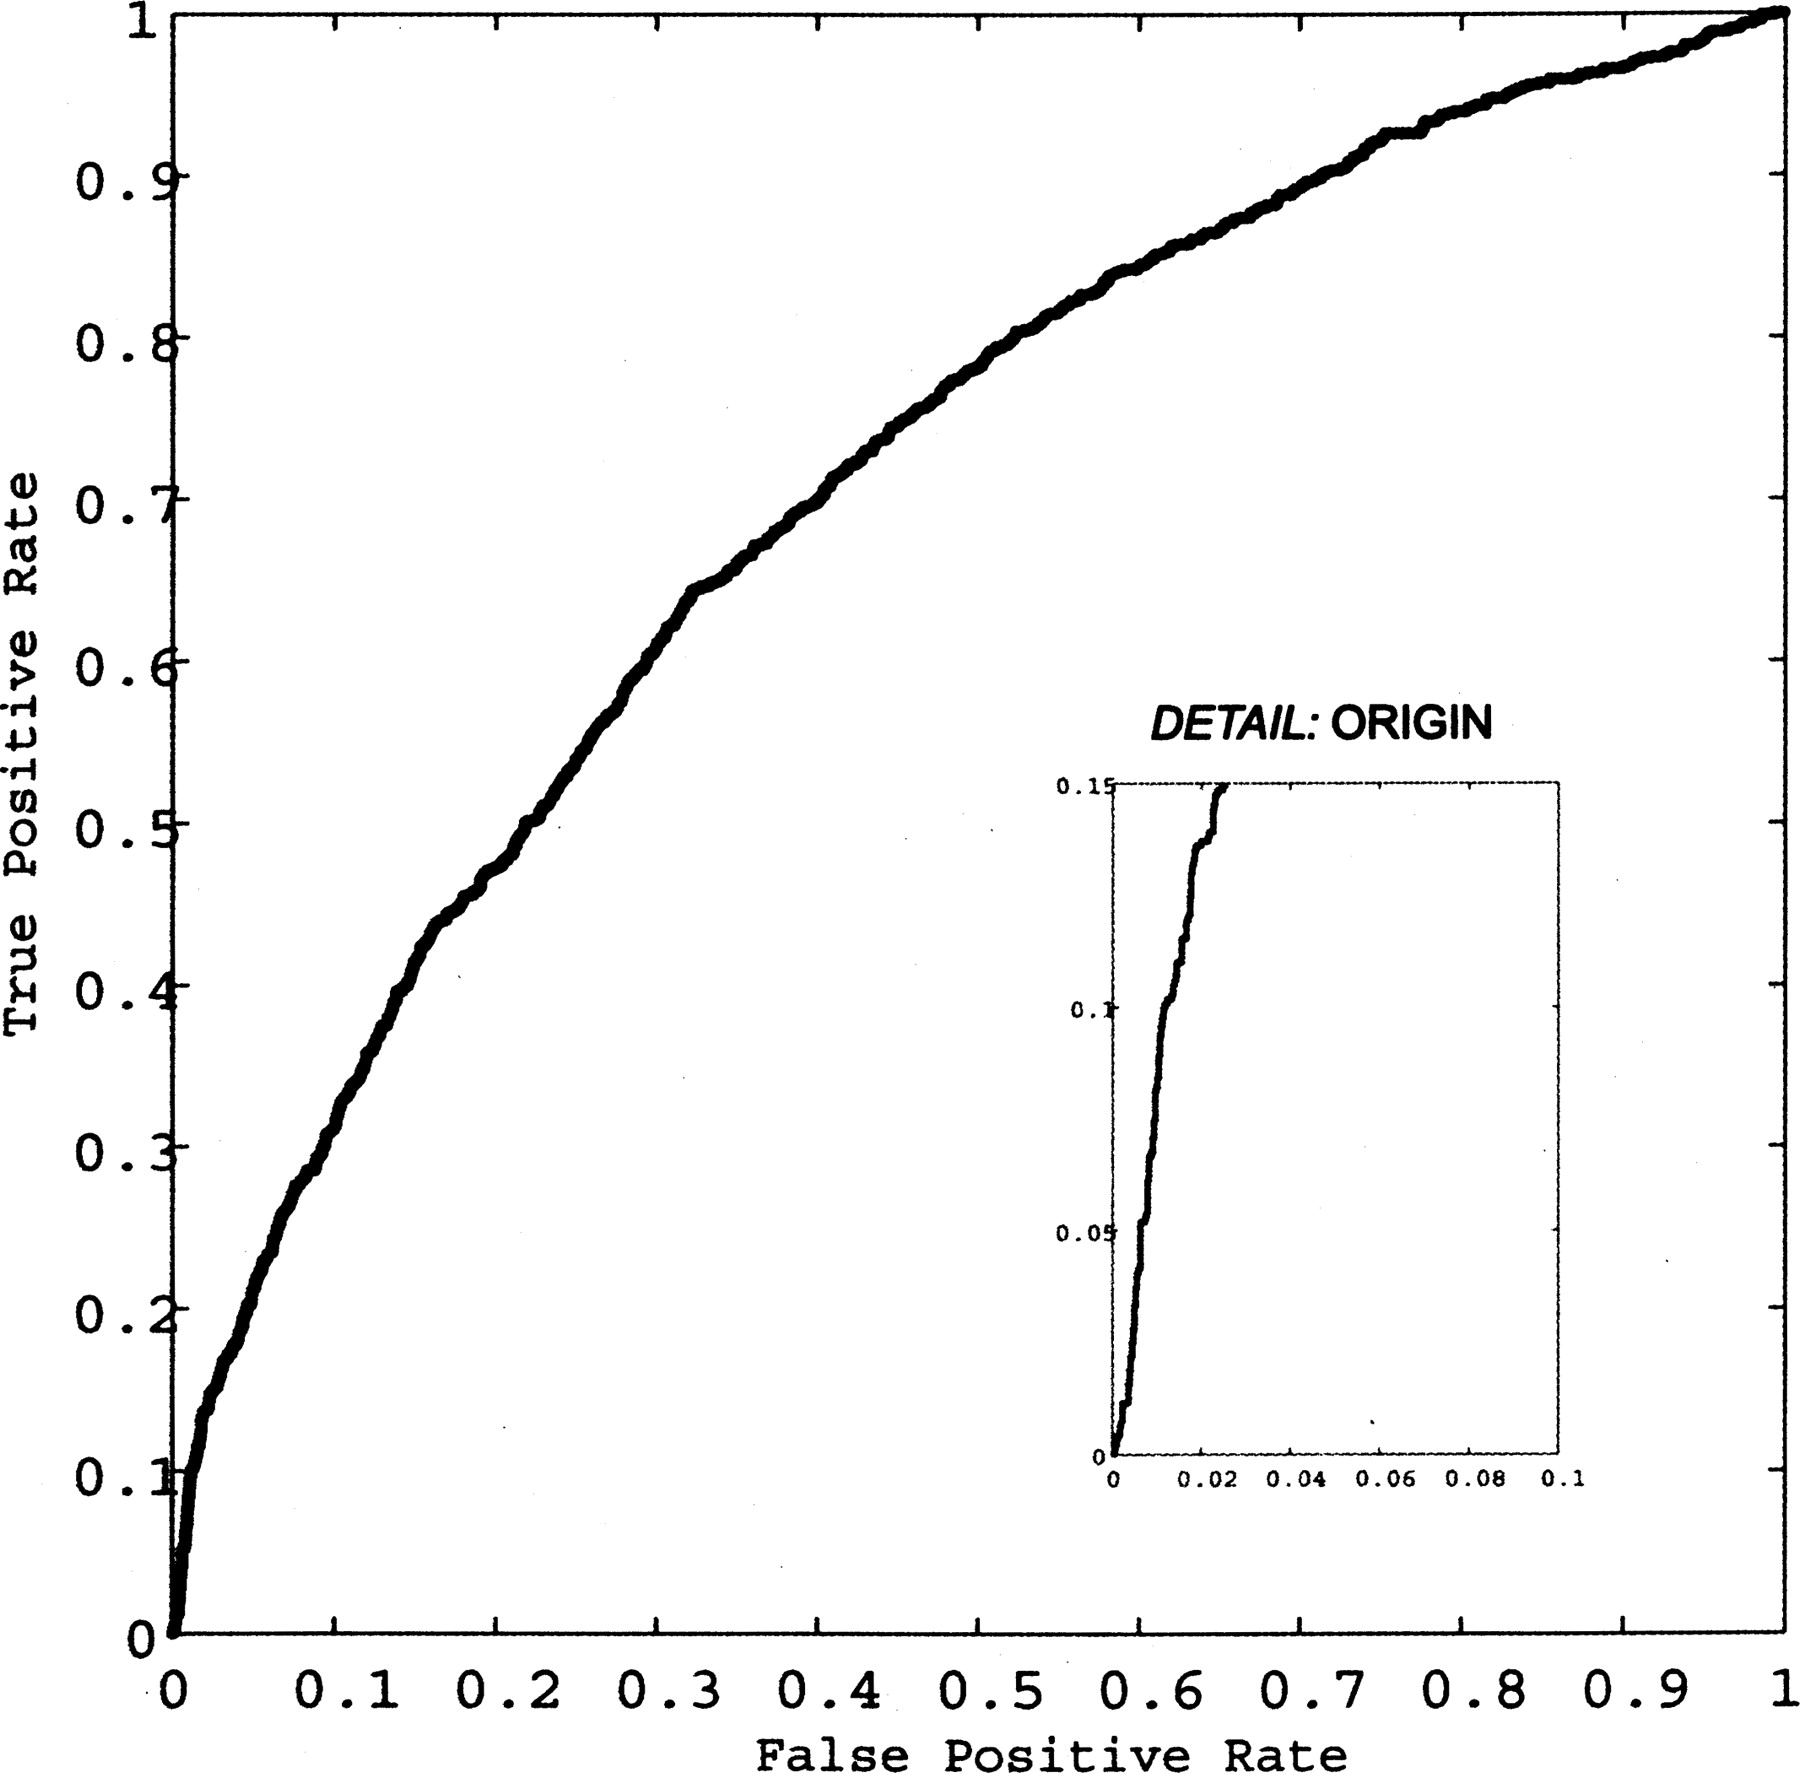
Figure 2.
Receiver Operating Characteristic curve for the classifier on the S. cerevisiae data set. This plots the true positive rate versus the false positive rate for different thresholds of classifier probability output.(Inset) The steep slope found near the origin signifies a high percentage of correct essentiality assignments among the top probability scores output by the classifier. Because we aim to predict a small subset of essential genes with high confidence, only the predictions found in this subset are relevant to our approach.


