
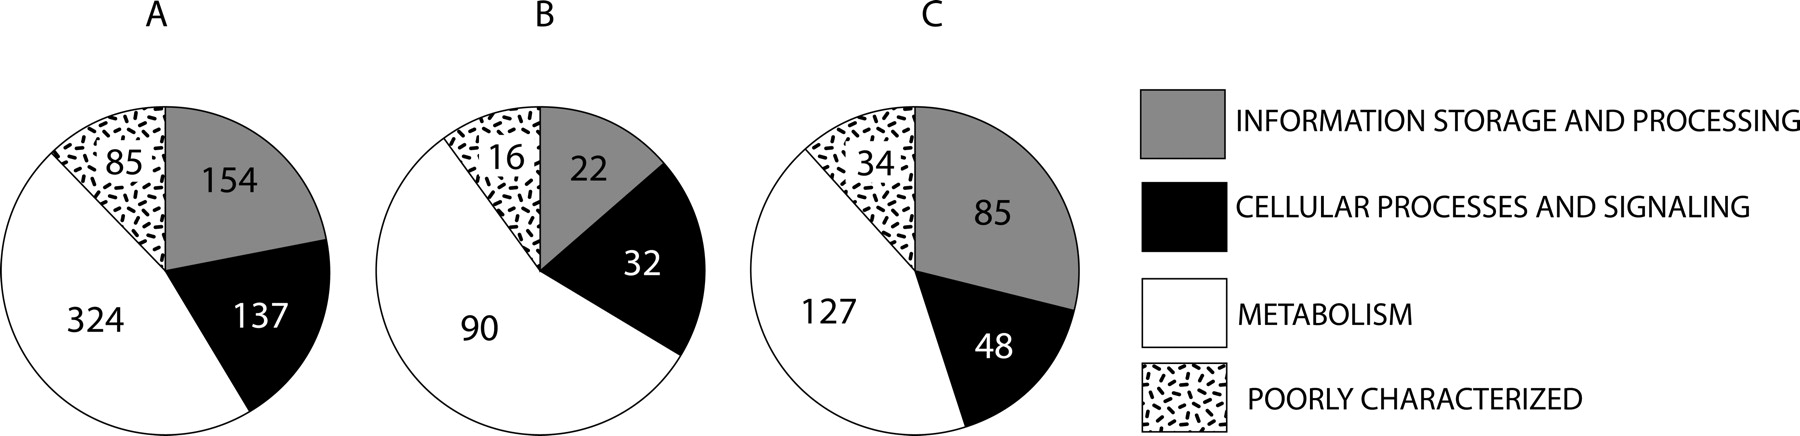
Distribution of phylogenetically useful extended genes across functional categories. Panel A shows the distribution of 700 phylogenetically useful extended data sets. Panel B shows the distribution of 160 sets where cyanobacteria do not form a monophyletic group (putative interphylum transfers). Panel C shows the distribution of 294 sets where cyanobacteria form a monophyletic group, but they conflict with the plurality signal (putative intraphylum transfers). Numbers inside the pie graphs refer to the number of sets of orthologous genes in each corresponding functional category. Across short phylogenetic distances, all types of genes appear to be equally affected by transfer, while across large phylogenetic distances, genes encoding metabolic functions are more frequently transferred, and genes in transcription and translation are transferred less frequently.


