
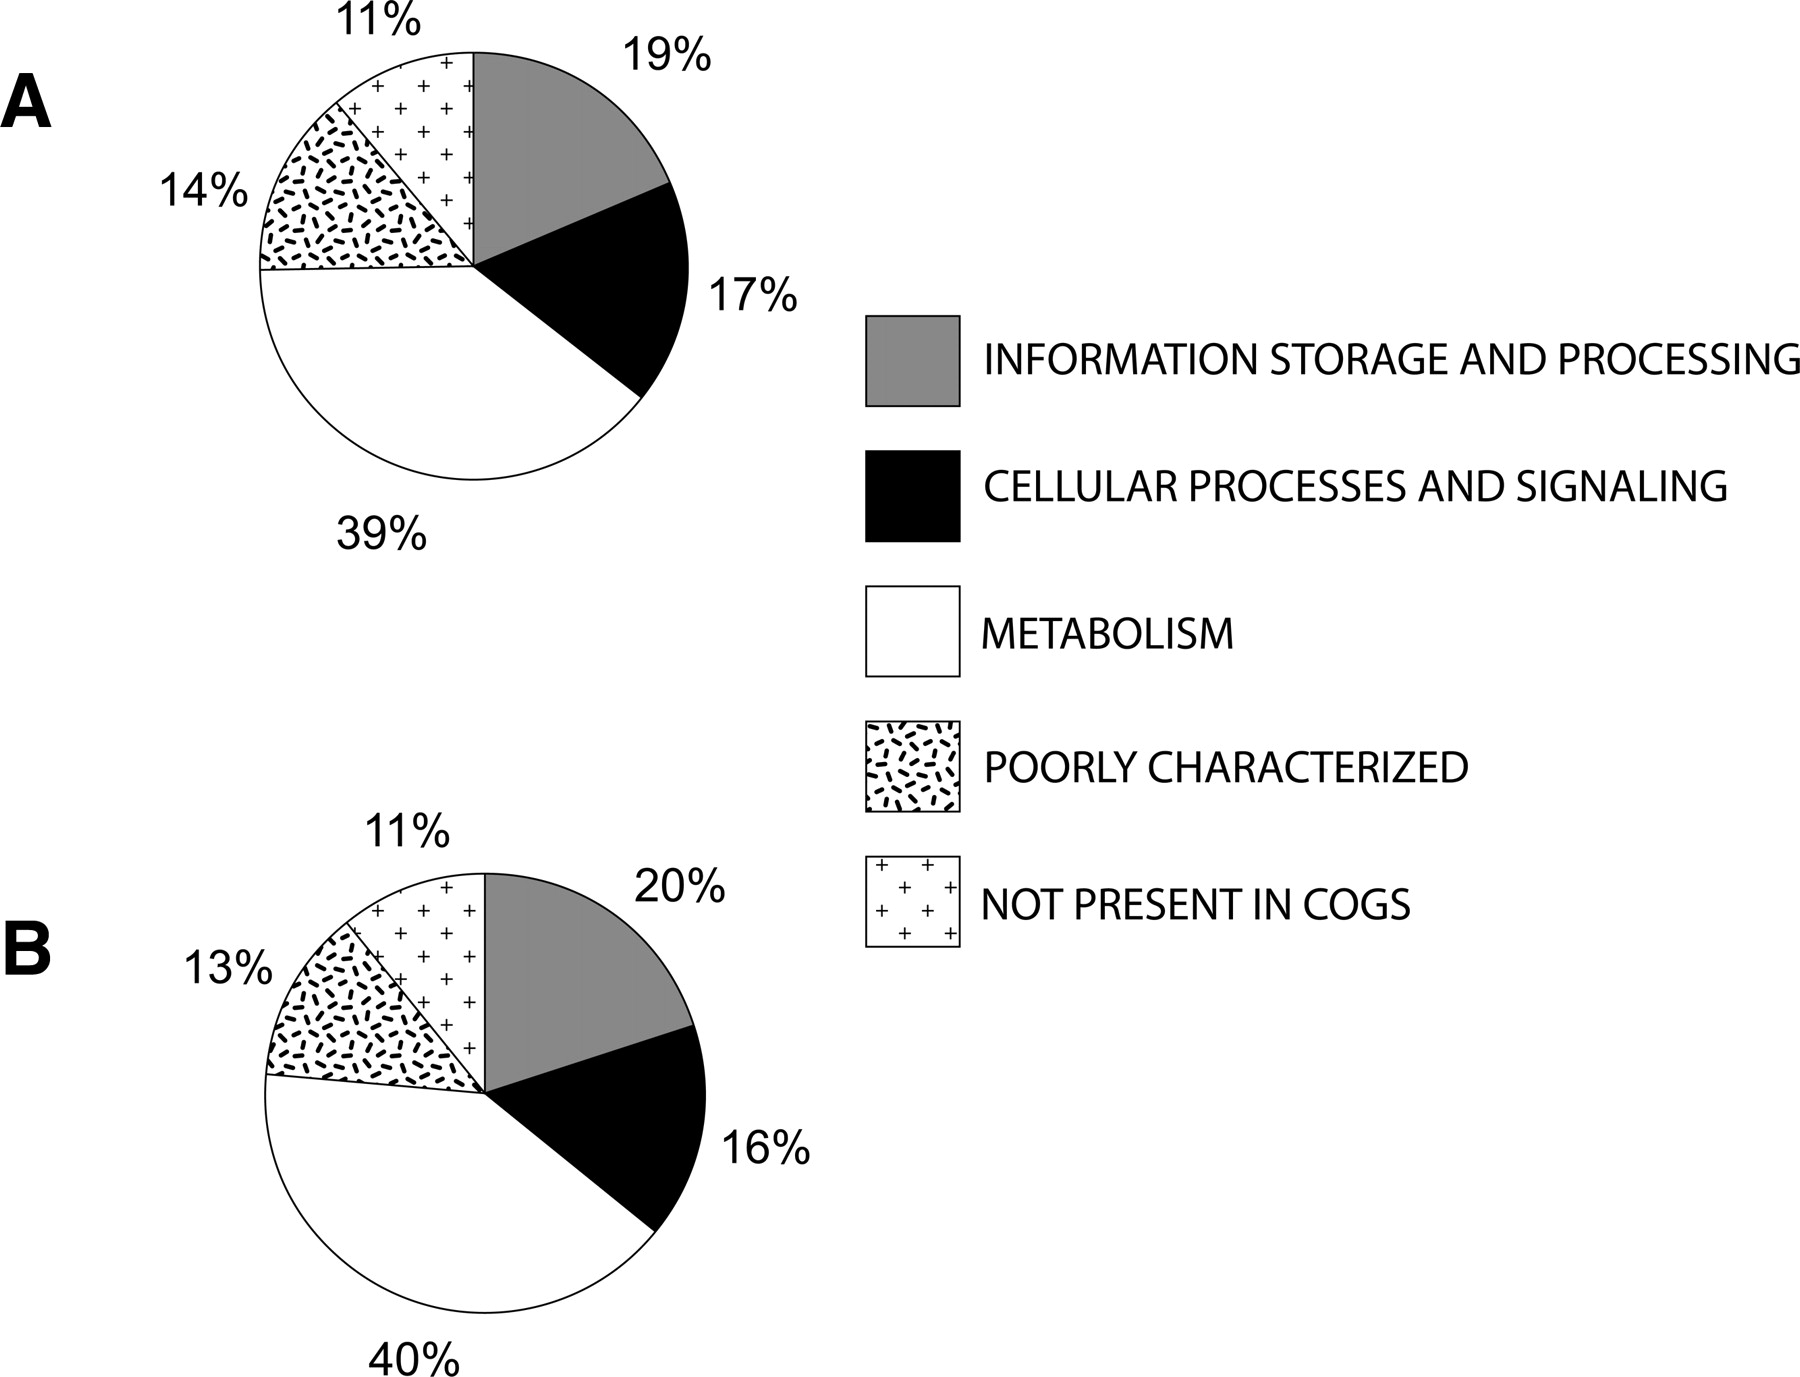
Figure 6.
Distribution of cyanobacterial sets of orthologous genes across functional categories. The functional categories are according to the COG database, March 2003 release (Tatusov et al. 2003). Panel A shows the distribution of all 1128 analyzed genes, while panel B shows the distribution of 685 genes that conflict with the plurality signal. Conflicts with the plurality signal are observed in sets of orthologs across all functional categories, including genes involved in translation and transcription, and no particular functional category shows bias toward conflicts.


