
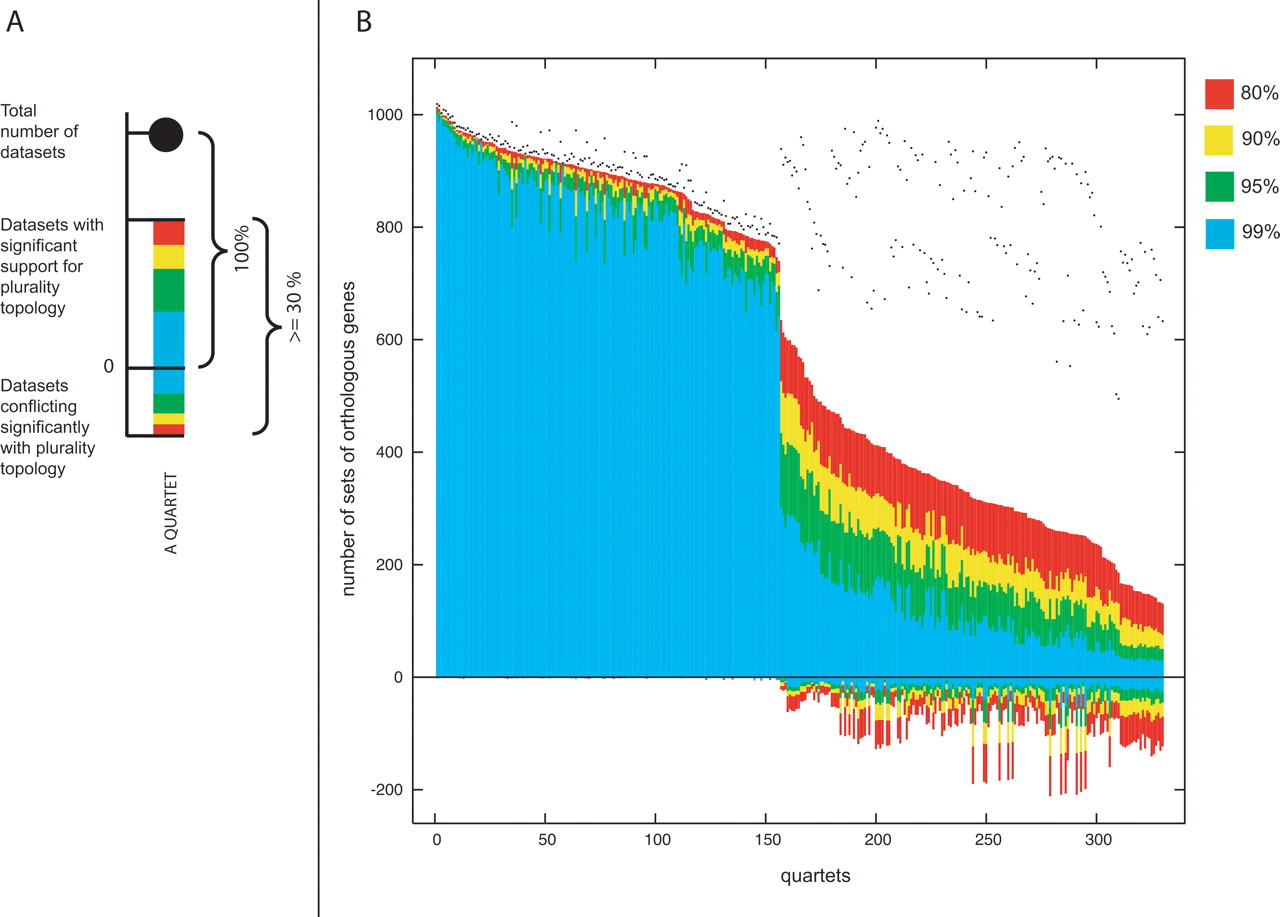
Quartet decomposition analysis of cyanobacteria. Panel A illustrates a component of quartet decomposition analysis. Each embedded quartet is represented by a vertical bar and a black dot. The black dot indicates how many data sets contain this embedded quartet. The vertical bar shows the number of data sets having the topology of the quartet that is supported by a plurality of gene families (value above zero) and the number of data sets having one of the other two quartet topologies (value below zero). The bar is color-coded with respect to bootstrap support. Only quartets that resolve the quartet relationships in at least 30% of analyzed data sets are visualized. The value of 30% was chosen based on simulations (see text for details). Panel B shows the quartet spectrum of 1128 sets of orthologous genes from cyanobacteria. Columns are sorted according to the number of supporting data sets with at least 80% bootstrap support. Quartets with a very short internal branch or very long external branches were excluded from the analyses to minimize artifacts of phylogenetic reconstruction. Quartets above the x-axis are combined into a plurality signal (see Fig. 3 and text for more details). Quartets below the x-axis are embedded into 685 unique sets of orthologous genes. The appearance of discontinuities in the spectrogram corresponds to the uneven phylogenetic distances among 11 analyzed genomes. For example, quartets containing two very closely related taxa (such as the ones containing both Nostoc and Anabaena) will almost unanimously agree on one of three possible quartet topologies.


