
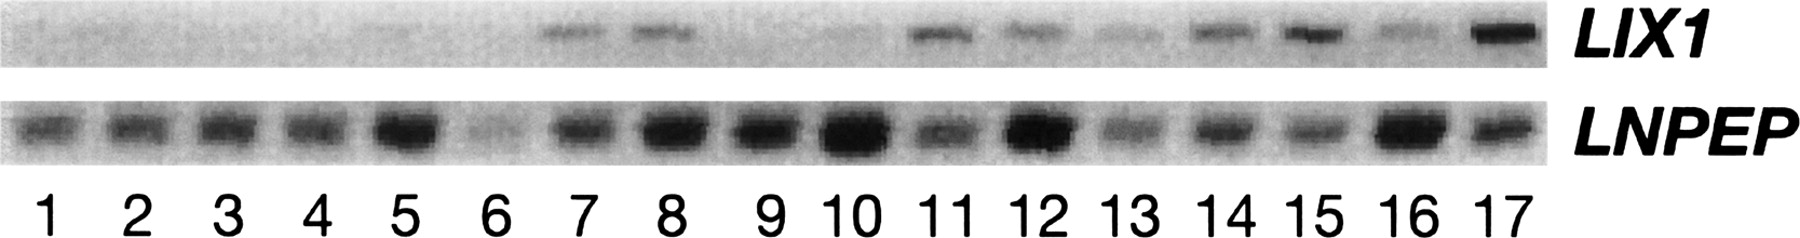
Figure 3.
Tissue expression of LIX1 and LNPEP. Shown are RT–PCR products of LIX1 and LNPEP amplified from multiple tissues of a genetically normal cat. (Lanes: 1, pancreas; 2, skeletal muscle; 3, fat; 4, liver; 5, spleen; 6, duodenum; 7, kidney cortex; 8, cardiac muscle; 9, adrenal; 10, thymus; 11, brainstem; 12, cerebellum; 13, brain cortex; 14, thalamus; 15, lumbosacral spinal cord; 16, pituitary; 17, cervical spinal cord.)


