
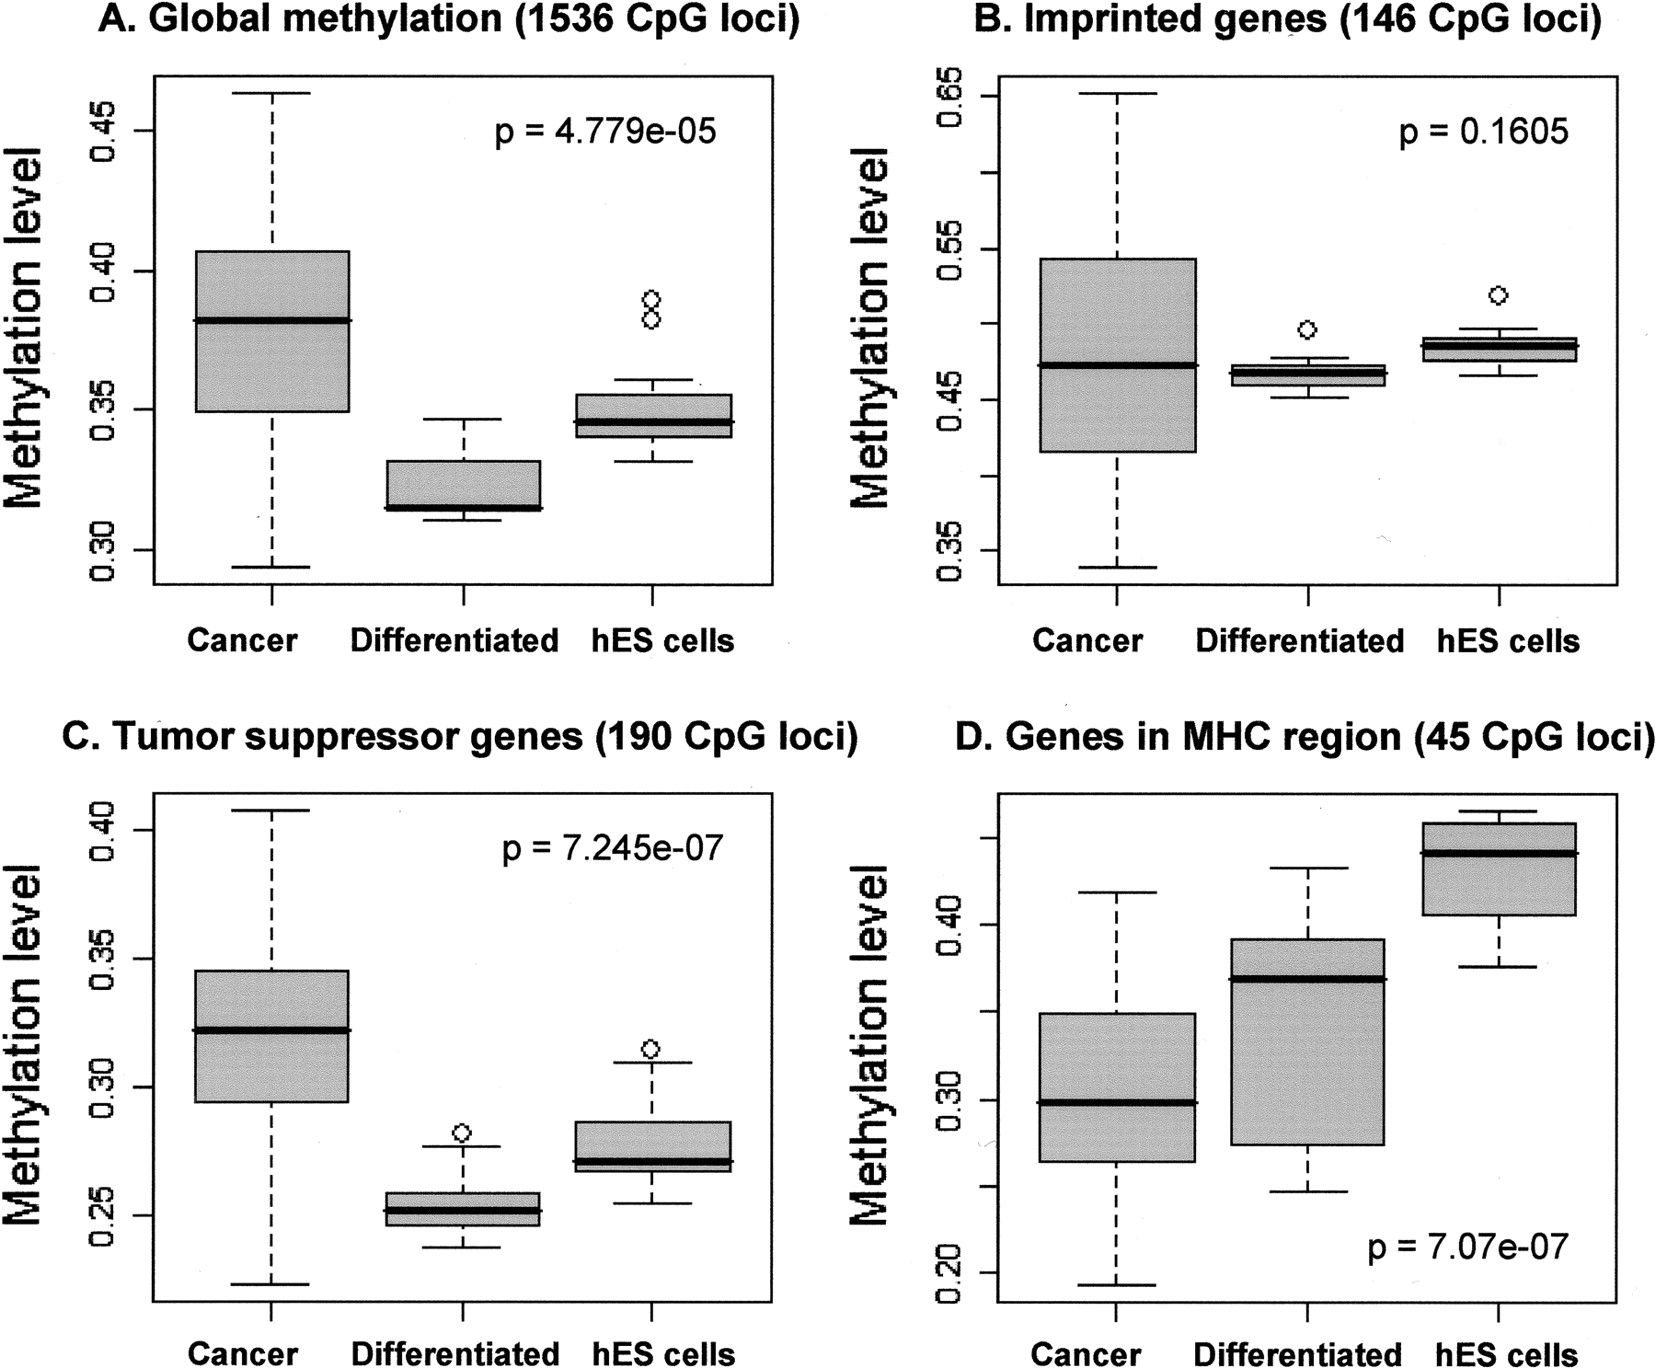
Boxplots of methylation levels in three sample groups—hES cells (N = 16), differentiated and somatic stem cells (N = 13), and cancer cell lines (N = 24). (A) Global methylation levels, calculated using all 1536 CpG sites; (B) methylation levels of 146 CpG sites in 33 imprinted genes; (C) methylation levels of 190 CpG sites in 45 tumor suppressor genes; (D) methylation levels of 45 CpG sites in 13 genes from the MHC region. The black bar represents the median methylation level for each cell type, calculated from the means of each individual cell line. The gray box defines quartiles (25% and 75%, respectively). The error bars are 1st and 99th percentiles of the distribution. Dots represent the outliers. P-values were computed using the Kruskal-Wallis test, which indicates the likelihood that all medians are the same.


