
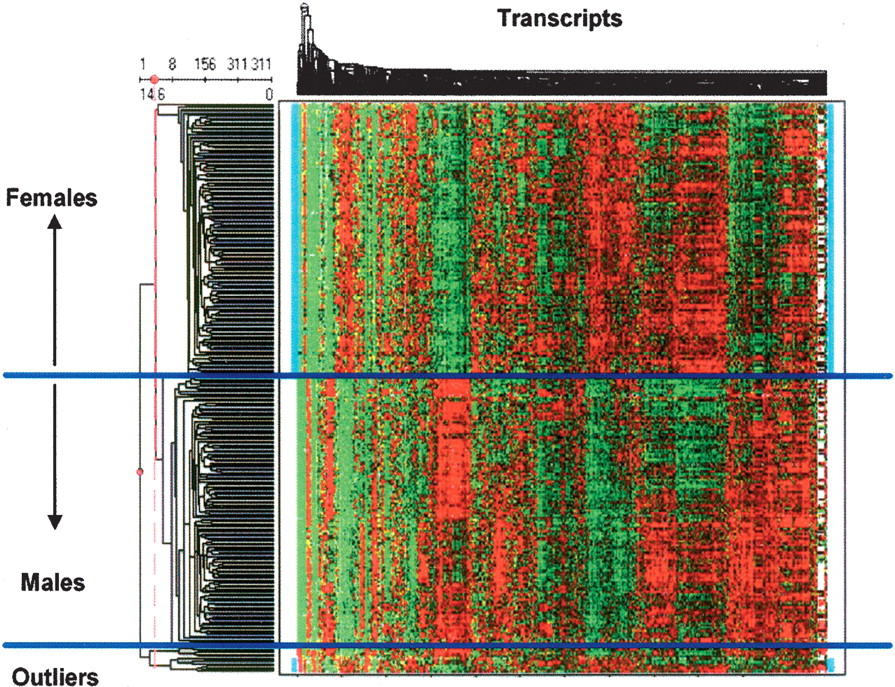
Two-dimensional hierarchical clustering of gene expression in livers of 334 BxH F2 mice. A set of 1332 most transcriptionally active genes are clustered on the horizontal axis, with individual mice clustered on the vertical axis. The major groups of mice resulting from the hierarchical clustering are labeled by sex. Female mice are also labeled with the vertical blue bars on the left and right sides of the heatmap. Red represents overexpression compared to the control (a pool of RNA comprised of equal aliquots of RNA from 150 F2 mice), and green represents underexpression. Brighter shades of red and green reflect higher degrees of over and underexpression. Black corresponds to no difference, and gray indicates missing data.


