
Table 1.
Summary statistics of resequenced candidate selection genes
Click on table to view larger version.
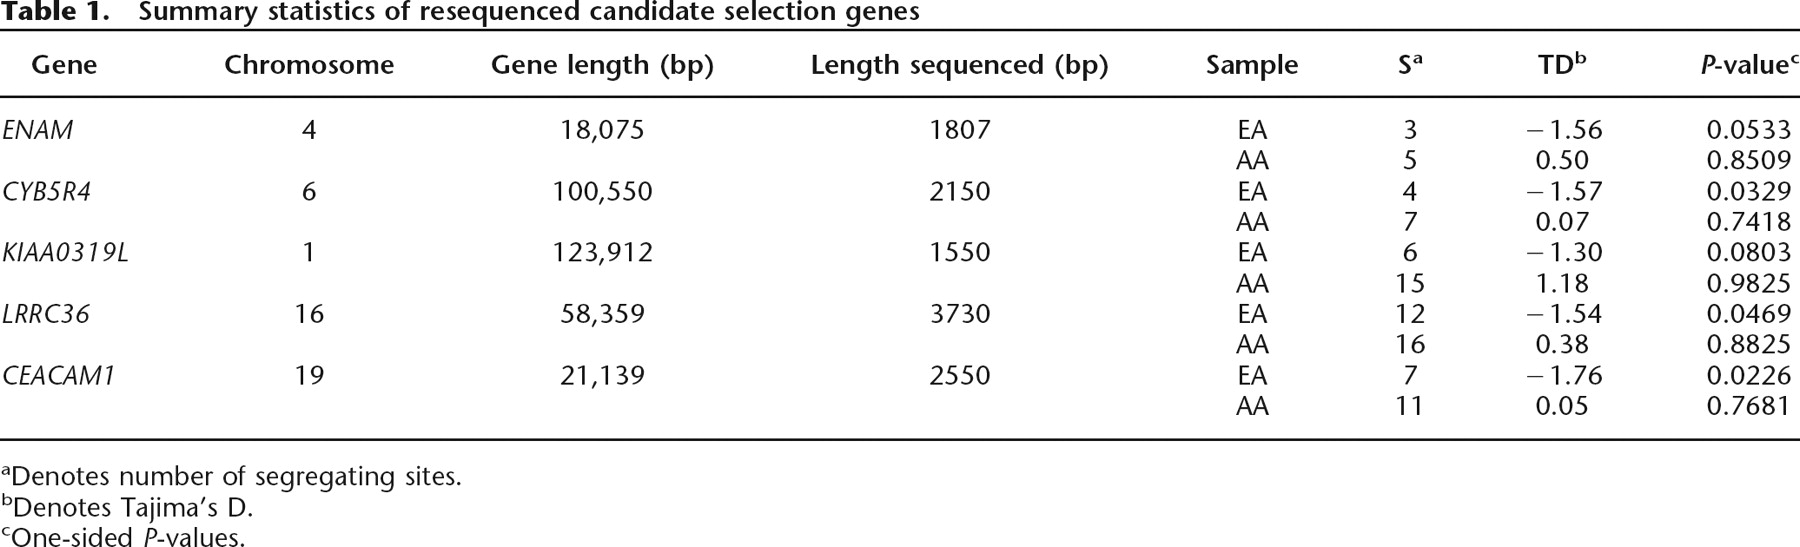
aDenotes number of segregating sites.
bDenotes Tajima’s D.
cOne-sided P-values.
Click on image to view larger version.
Summary statistics of resequenced candidate selection genes
Click on table to view larger version.
aDenotes number of segregating sites.
bDenotes Tajima’s D.
cOne-sided P-values.
 CiteULike
 Delicious
 Digg
Digg Facebook
 Google+
 Reddit
 Twitter
