
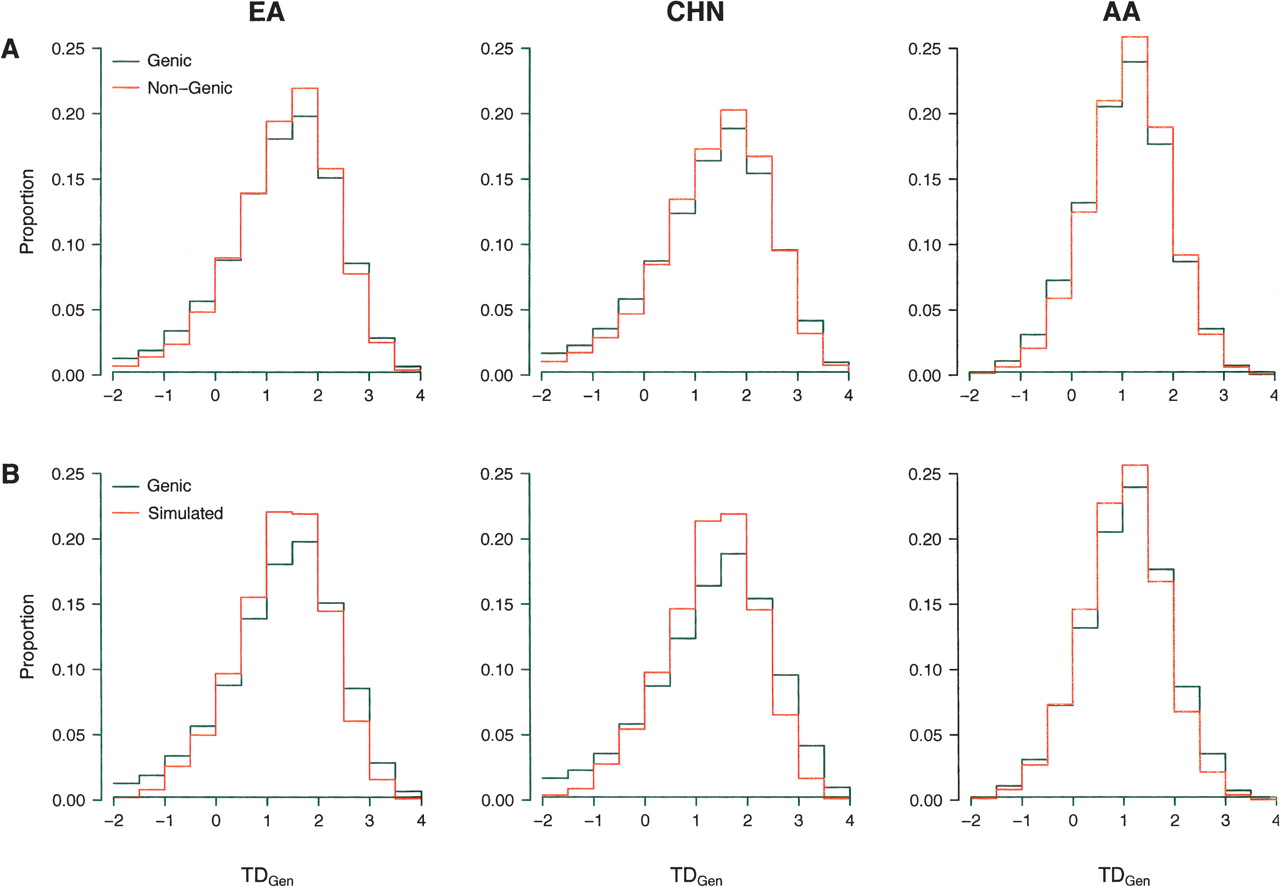
Figure 3.
Comparing the observed distribution of TDGen to neutral expectations. The observed distribution of TDGen in genic regions compared to that observed for nongenic regions (A) and coalescent simulations (B) incorporating demographic perturbations and ascertainment bias. In modeling ascertainment bias, we considered the full range of discovery chromosomes from ND = 2 to NT, where NT = 48, 48, and 46 for the EA, CHN, and AA samples, respectively. Shown here are the simulated distributions that most closely match the observed distributions in each sample (ND = 11, 8, and 5 for the EA, CHN, and AA samples, respectively). The full details of the simulations are described in the Methods.


