
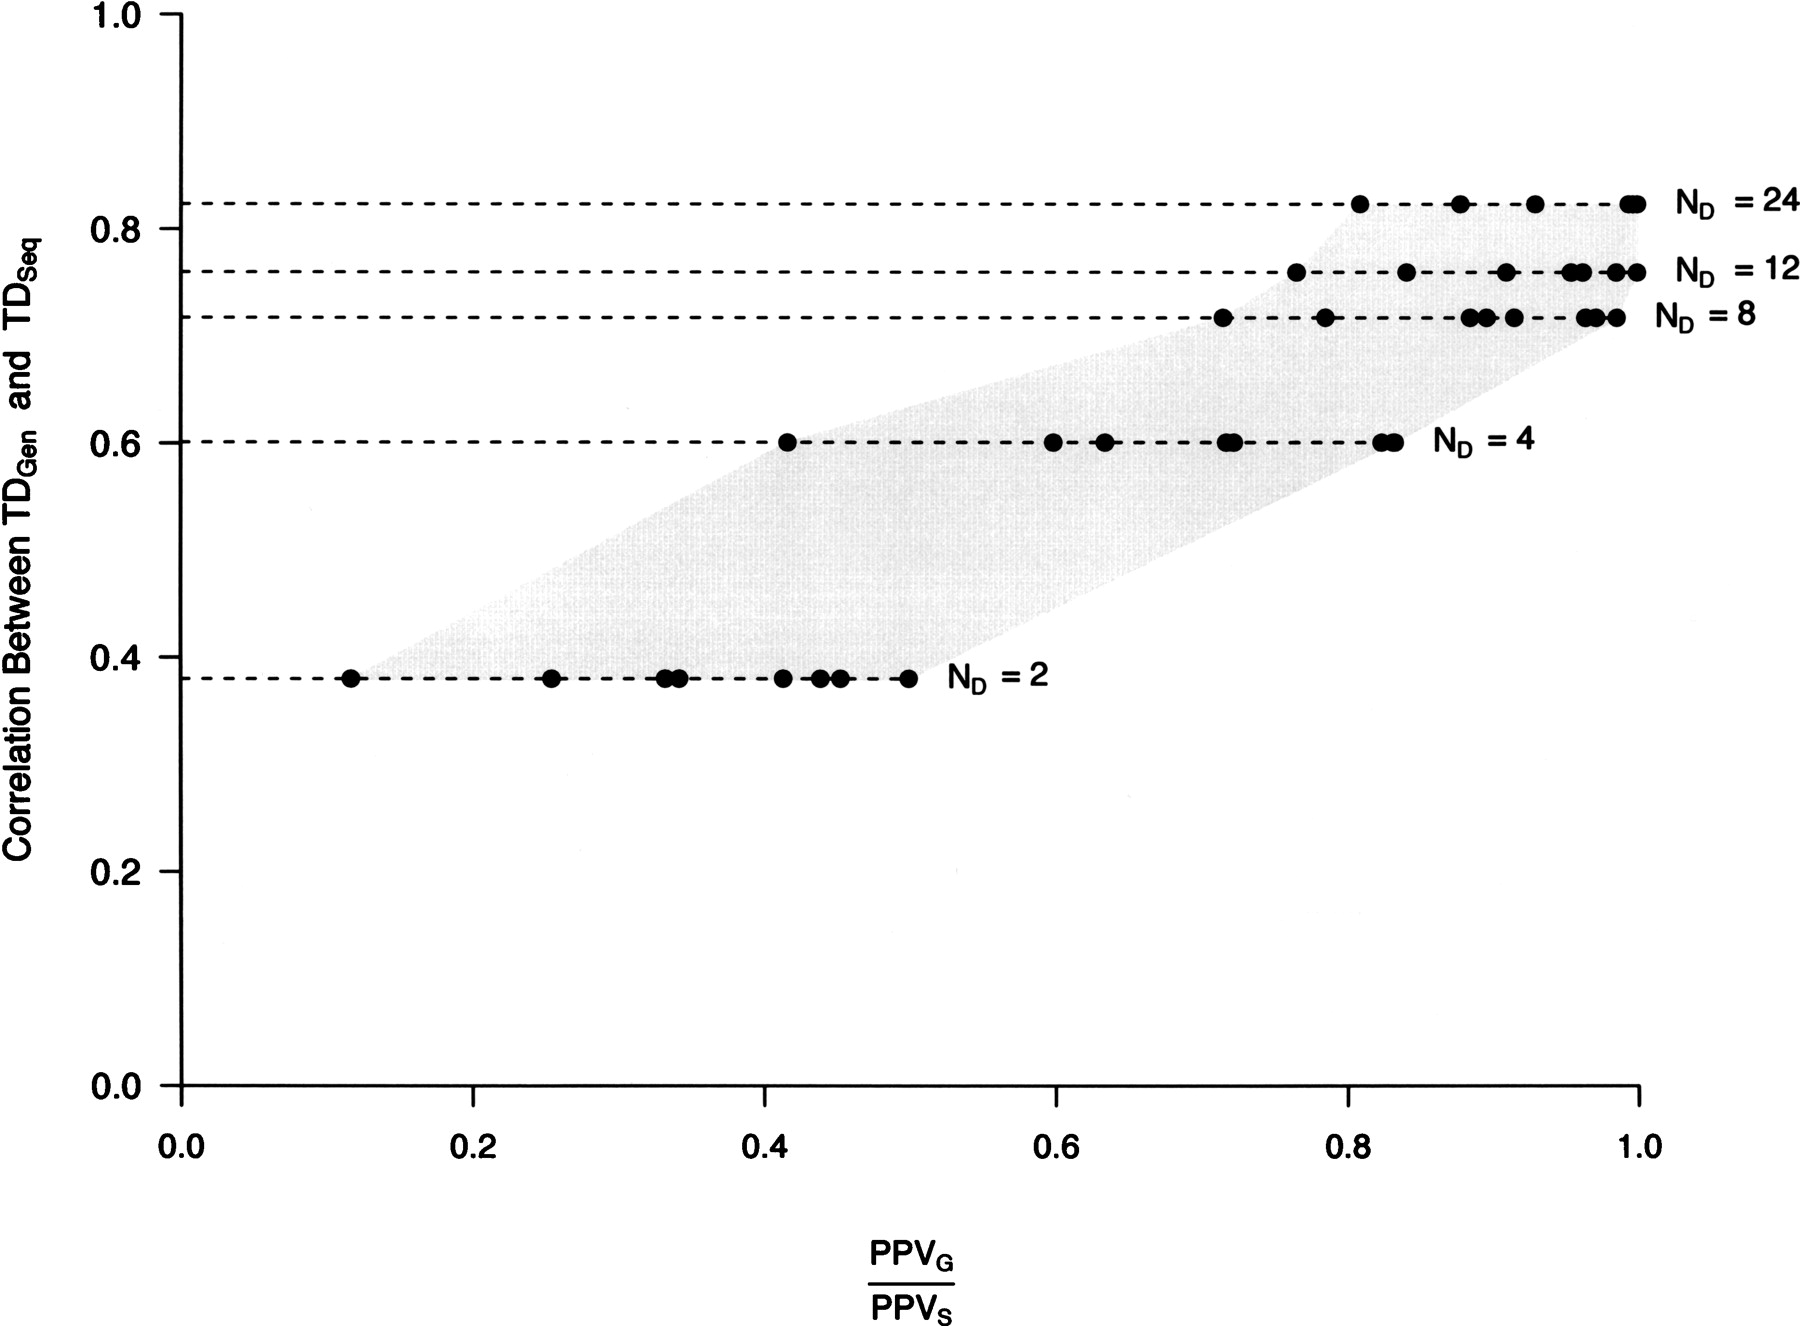
The correlation between TDSeq and TDGen predicts the performance of a simple outlier approach in ascertained data sets. The correlation, r, between Tajima’s D derived from complete sequence (TDSeq) and genotype (TDGen) data was calculated from the data sets described in Figure 1. ND denotes the number of chromosomes used for SNP discovery. Discovered SNPs were then genotyped in the sample panel and used to calculate TDGen (see Fig. 1 legend). For each value of ND, there are eight points, which correspond to all combinations of simulation parameters: σ (20 and 200), fraction of positively selected loci (1% and 10%), and threshold used in defining candidate selection genes (1% and 5%). Note that for each value of ND the correlation between TDSeq and TDGen for the eight different parameter combinations differed by <1%, and thus for presentation purposes, the average correlation is shown. The gray shaded area helps to demark the range of (PPVG/PPVS) values for each value of ND and simulation parameters.


