
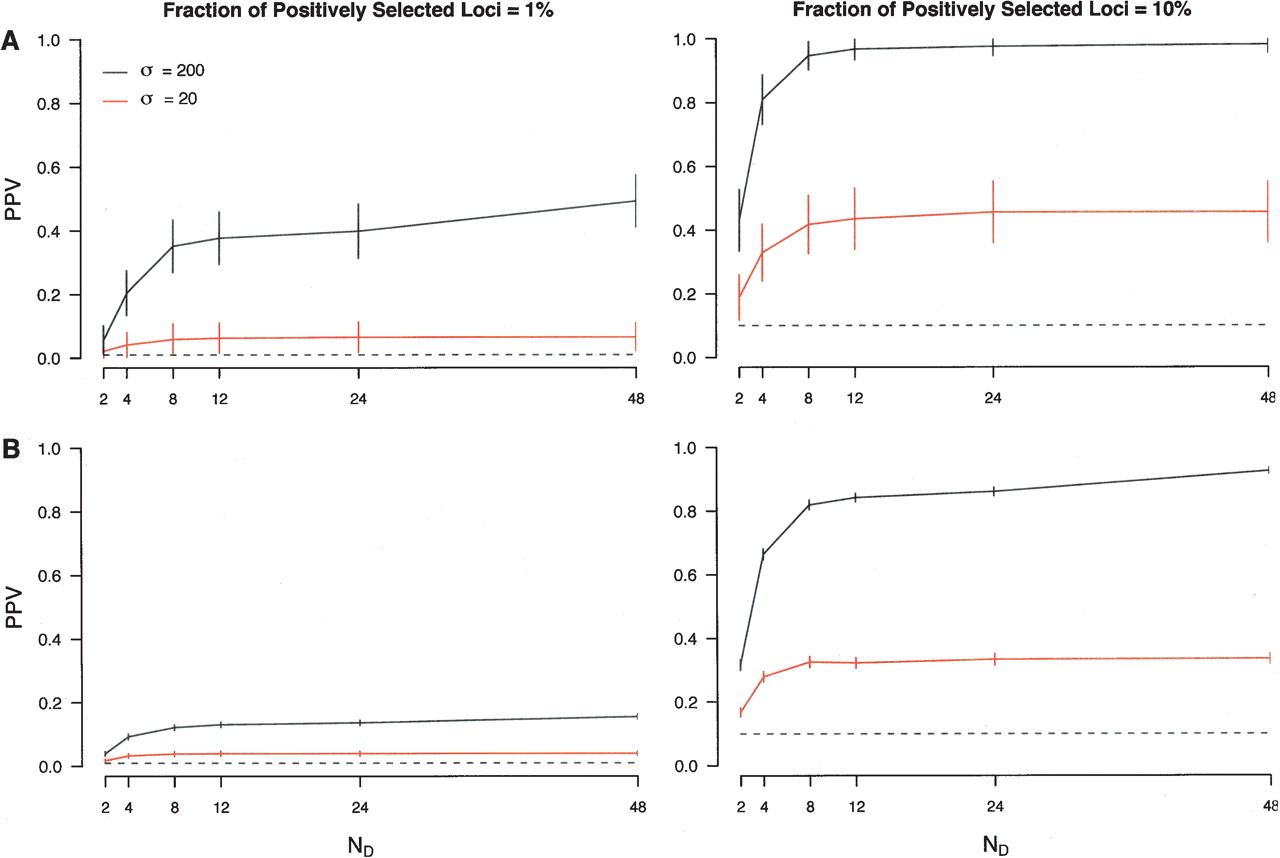
Performance of a simple outlier approach in ascertained data. Patterns of polymorphism were simulated for 1000 unlinked loci consisting of varying fractions of neutral and positively selected loci (indicated at the top of each column). For each locus, 72 chromosomes were simulated and divided into discovery (24) and sample panels (48). SNP discovery was then performed by randomly selecting ND chromosomes from the discovery panel, which were then “genotyped” in the sample set, and the resulting genotypes used to calculate TDGen. The x-axis denotes the values of ND considered. Note that ND = 48 corresponds to complete ascertainment (i.e., complete sequence data). The y-axis denotes the positive predictive value (PPV) when using a threshold of either the first (A) or fifth (B) percentiles of the empirical distribution of TDGen. Horizontal dashed lines equal the expected PPV based on randomly sampling either 10 (1% threshold) or 50 (5% threshold) loci. Vertical bars indicate 95% confidence intervals. Black and red lines denote simulation results in which the scaled population selection coefficient, σ = 2Nes, for positively selected loci was 200 or 20, respectively.


